. 2019 Apr 4;8:e46525. doi: 10.7554/eLife.46525

Figure 1. Reversible inactivation of the BNST attenuates conditioned fear expression to a backward, but not forward, CS.

(A) Behavioral schematic. (B) Freezing behavior at conditioning and retrieval testing. For conditioning, the left panel depicts mean percentage freezing during the 5 min baseline (BL) and across each conditioning block (each 136 s block is comprised of two trials; conditioning trials consist of freezing during the 10 s CS followed by the 58 s interstimulus interval). For retrieval testing, the center panel shows mean percentage freezing at the 5 min baseline (BL) and across each test block (each 140 s block is comprised of two trials; trials consist of freezing during the 10 s CS followed by the 60 s interstimulus interval). The right panel shows mean percentage freezing during the first half of the test (trials 1–6; corresponding to 420 s of behavior). All data are represented as means ± s.e.m [FW-VEH (n = 5); FW-NBQX (n = 4); BW-VEH (n = 13); BW-NBQX (n = 12); NoCS(Test)-VEH (n = 8); NoCS(Test)-NBQX (n = 8)]; * = p < 0.05.

Figure 1—source data 1.
DOI: 10.7554/eLife.46525.008

Figure 1.

Figure 1—figure supplement 1. Representative bilateral cannula placements in the BNST.

Figure 1—figure supplement 1.

Photomicrograph (10×) of a thionin-stained coronal section depicting representative cannula tracts in the BNST (top panel). Fluorescent image (gold filter) of a coronal section (10×) showing spread of drug in BNST (BNST outlined in dotted line) (bottom panel).
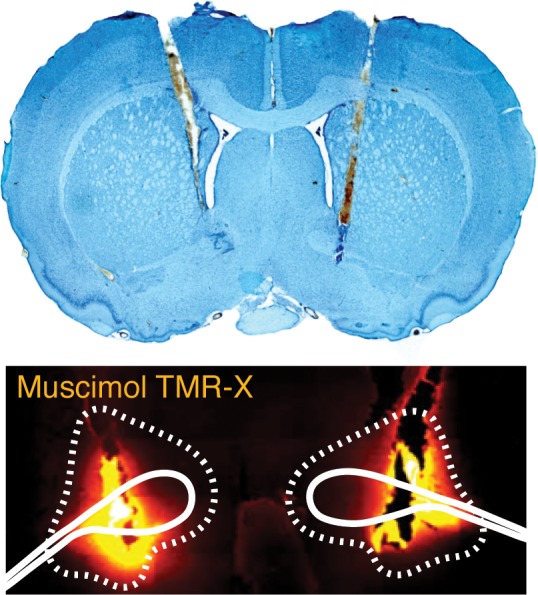
Figure 1—figure supplement 2. Bilateral cannula placements for BNST microinfusions.

Figure 1—figure supplement 2.

Schematic depicting cannula placements for Figure 1. Symbols (split by each group) correspond to injector tips (approximate borders of BNST are shown by red dotted outline; approximate borders of BNST are shown by red dotted outline).
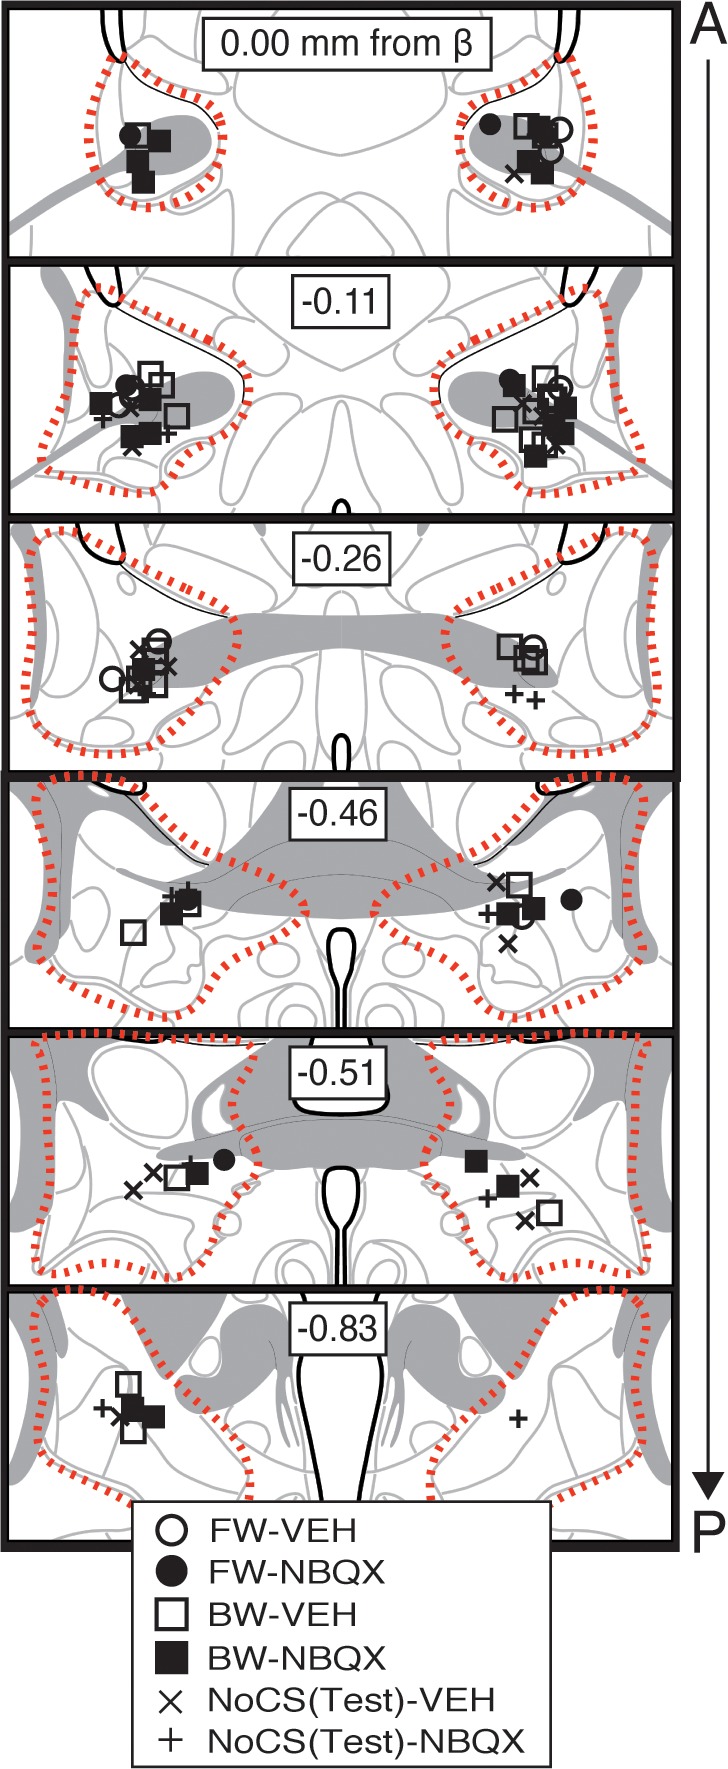
Figure 1—figure supplement 3. Effects of BNST inactivation on freezing to a forward vs. backward CS trained with five trials.

Figure 1—figure supplement 3.

(A) Behavioral schematic. (B) Freezing behavior during conditioning and retrieval testing. For conditioning, the left panel depicts mean percentage freezing during the 3 min baseline (BL) and across each conditioning block (each 136 s block is comprised of two trials; conditioning trials consist of freezing during the 10 s CS followed by the 58 s interstimulus interval). For retrieval testing, the center panel shows mean percentage freezing at the 3 min baseline (BL) and across each test trial (each trial consists of freezing during the 10 s CS followed by the 60 s interstimulus interval). The right panel shows mean percentage freezing after baseline (trials 1–5; corresponding to 350 s of behavior). All data are represented as means ± s.e.m [FW-VEH (n = 6); FW-NBQX (n = 6); BW-VEH (n = 7); BW-NBQX (n = 6)]; * = p < 0.05.
Figure 1—figure supplement 4. Bilateral cannula placements for BNST microinfusions.

Figure 1—figure supplement 4.

Schematic depicting cannula placements for Figure 1—figure supplement 3. Symbols (split by each group) correspond to injector tips (approximate borders of BNST are shown by red dotted outline).
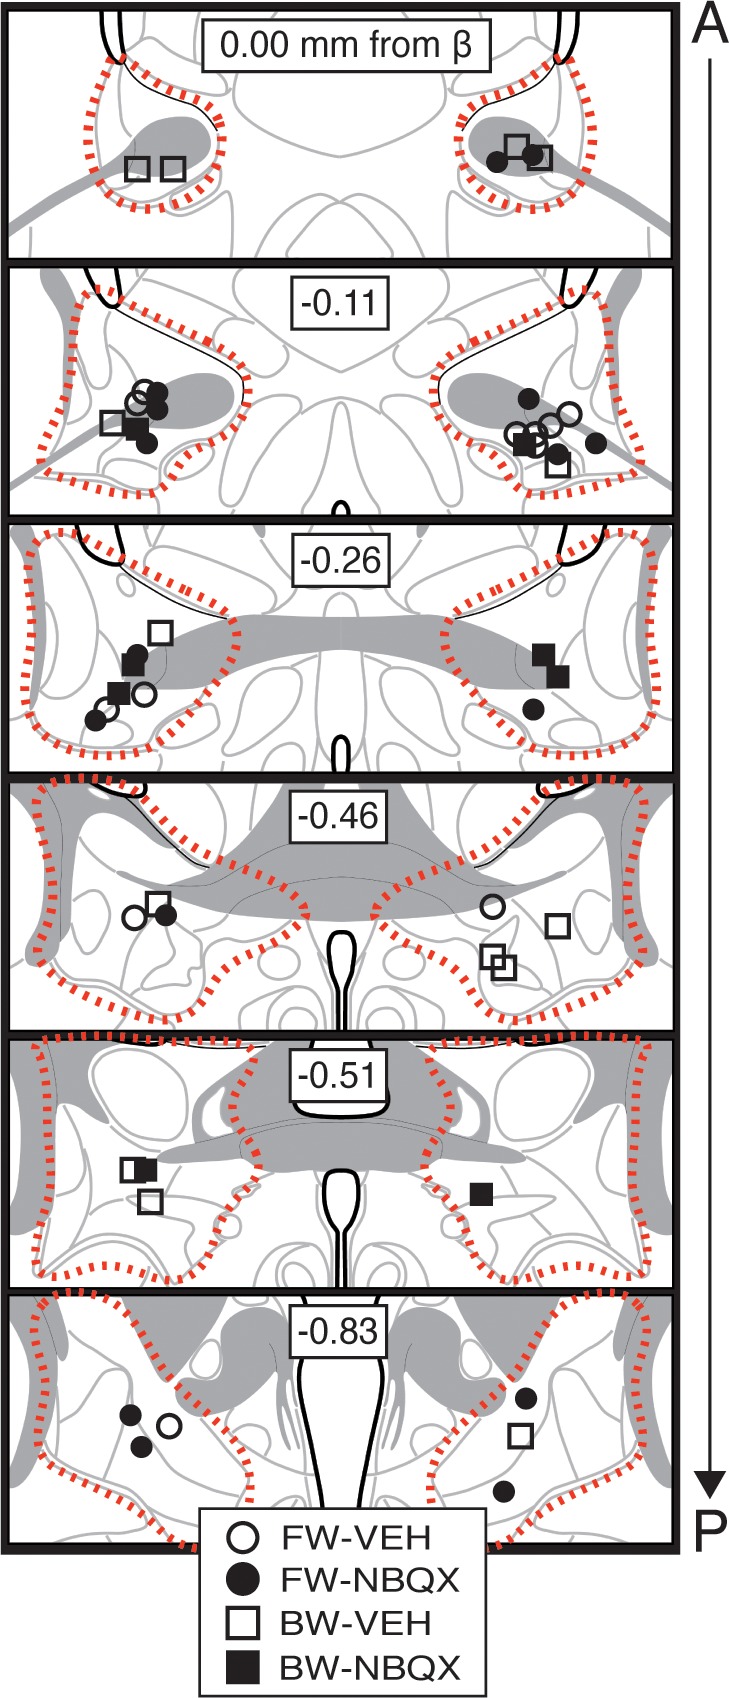
Figure 1—figure supplement 5. Shock-induced activity during conditioning to a forward vs. backward CS.

Figure 1—figure supplement 5.

(A) Mean percentage of freezing at baseline (BL; 5 min) and across conditioning blocks (each 136 s block is comprised of two trials; trials consist of freezing during the 10 s CS followed by the 58 s interstimulus interval). (B) Mean activity values across the 5 min BL (no shock present). (C) The left panel shows mean shock-induced activity (during shocks) at conditioning [averaged into 4 s (two-shock) blocks]. The right panel shows mean shock-induced activity across all trials. All data are represented as means ± s.e.m [FW (n = 16); BW (n = 16)]; * = p < 0.05.