Figure 2. BNST inactivation attenuates freezing to a discrete CS paired with random onset of shock.
(A) Behavioral schematic. (B) Freezing behavior during conditioning and retrieval testing. For conditioning, the left panel depicts mean percentage freezing during the 5 min baseline (BL) and across each conditioning block (each block is comprised of two trials; trials consist of freezing during the 10 s CS followed by the 58 s interval for the BW animals, whereas blocks for the other groups include equivalent time periods which include the CS [if present] and inter-CS intervals [excluding the duration of the shock]). For retrieval testing, the center panel shows mean percentage freezing at the 5 min baseline (BL) and across each test block (each 140 s block is comprised of two trials; trials consist of freezing during the 10 s CS followed by the 60 s interval). The right panel shows mean percentage freezing across the first two test trials (after BL; corresponding to 140 s of behavior). All data are represented as means ± s.e.m [RANDOM-VEH (n = 6); RANDOM-MUS (n = 9); BW-VEH (n = 5); BW-MUS (n = 7); NoCS(Cond)-VEH (n = 7); NoCS(Cond)-VEH (n = 6)]; * = p < 0.05.

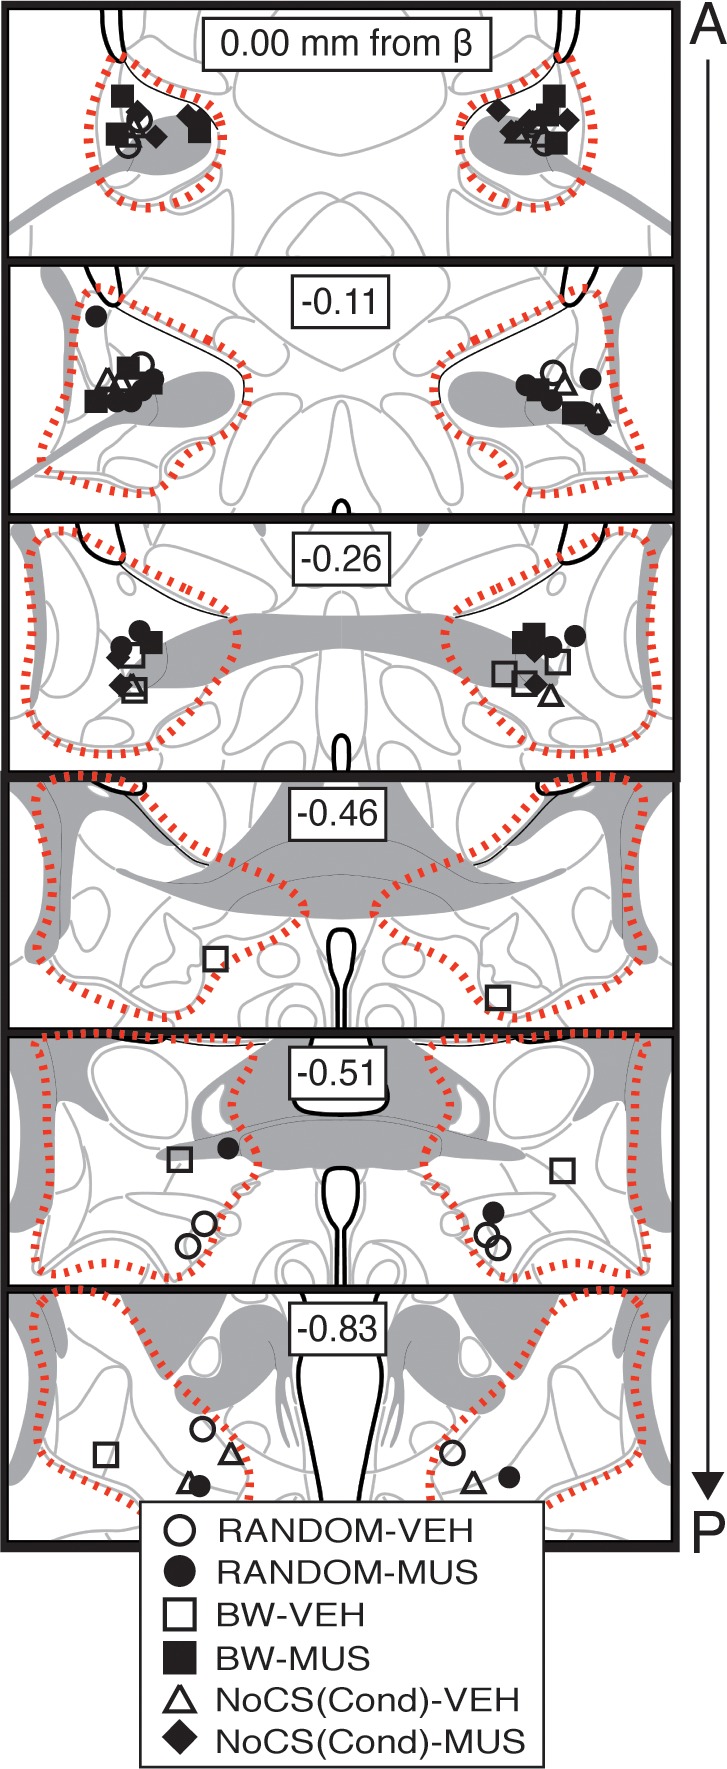
Figure 2—figure supplement 1. Bilateral cannula placements for BNST microinfusions.