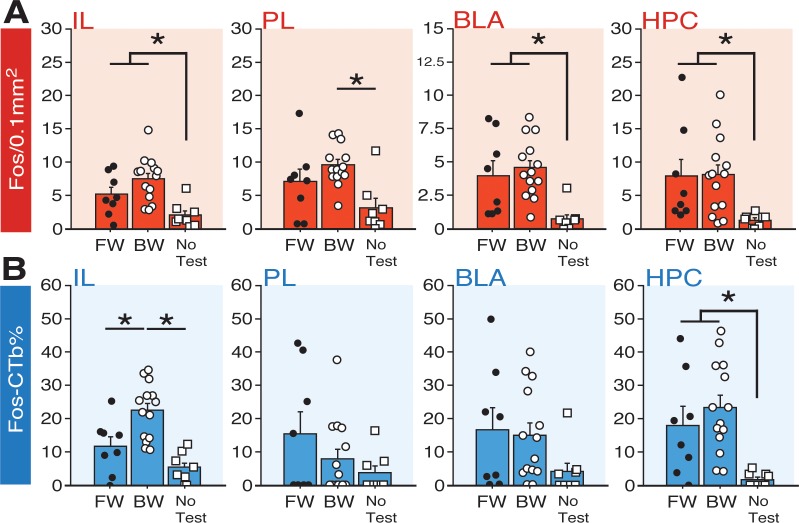
Figure 7. Fos expression in BNST-targeting cells of the prefrontal cortex, amygdala, and hippocampus following exposure to a forward or backward CS.
(A) Mean number of Fos-positive cells (per 0.1 mm2) for each of the quantified regions. (B) Mean percentage (per 0.1 mm2) of Fos-positive and CTb-positive cells divided by the total number of CTb-positive cells for each region. All data are represented as means ± s.e.m [FW (n = 8); BW (n = 14); NoTest (n = 8)]; * = p < 0.05.

