Figure 1. Reduced lifespan and increased tumor incidence in Kdm6a F1s.
(A) Cross for Kdm6a F1 and control F1 mice. All Kdm6a cKO (n = 3) and control (n = 2) mice were littermates. (B) Survival curve for Kdm6a F1 and control F1 males. Hazard ratio (HR) and p-value calculated by a Cox proportional hazards model. (C) Raw counts of tumors (p=0.0071) and non-tumor phenotypes (p=0.69) in Kdm6a F1 vs. control F1 males at necropsy (p-values, one-sample test of proportions). (D) Left to right, hematoxylin and eosin (H&E) staining of normal spleen in control F1; H&E of histiocytic sarcoma in spleen of Kdm6a F1, showing diffuse infiltration of red pulp with nuclear pleomorphism and frequent mitotic figures (inset); immunohistochemistry of monocyte-lineage marker F4/80 in spleen histiocytic sarcoma. (E) H&E of representative tumors in Kdm6a F1s (top) and matched normal tissues from control F1s (bottom). Scale bars, 100 um (large images), 10 um (insets). See Figure 1—source data 1.

Figure 1—figure supplement 1. Normal spermatogenesis in Utx cKO males.
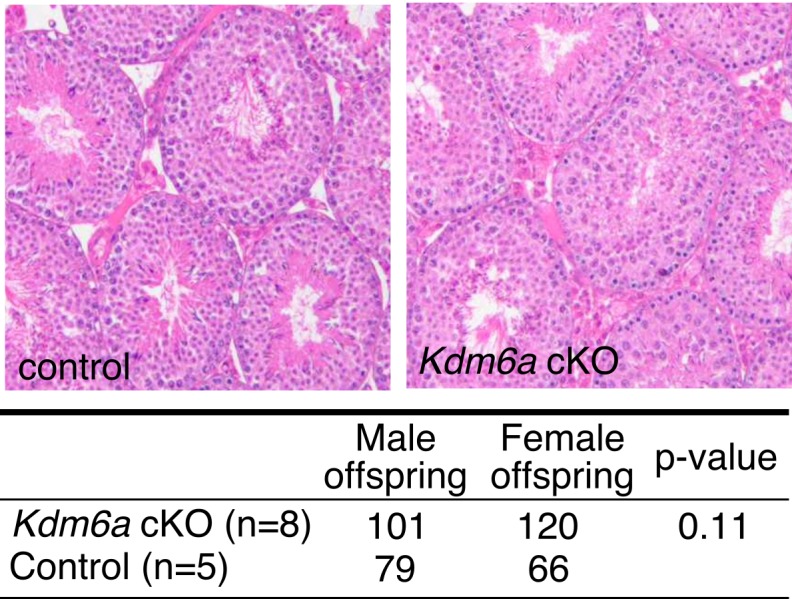
Figure 1—figure supplement 2. Efficiency of Ddx4-Cre in the male germ line.
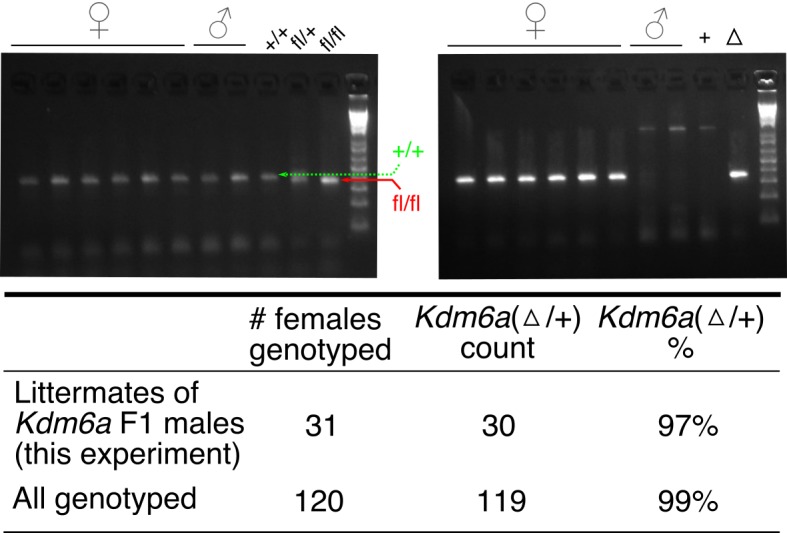
Figure 1—figure supplement 3. Survival of Kdm6a F1s from individual sires.

Figure 1—figure supplement 4. Survival of Kdm6a F1s grouped by presence or absence of the Cre transgene.
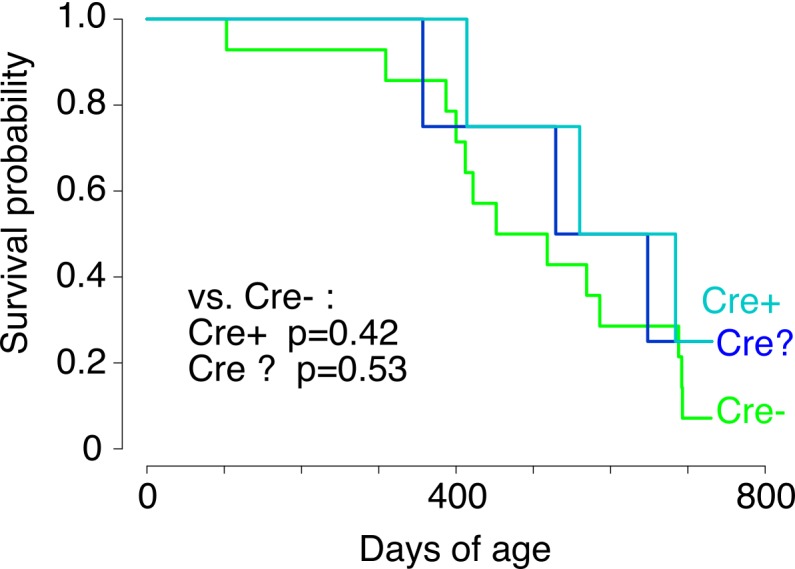
Figure 1—figure supplement 5. Contingency table for euthanasia vs.natural death in Kdm6a F1s and control F1s.
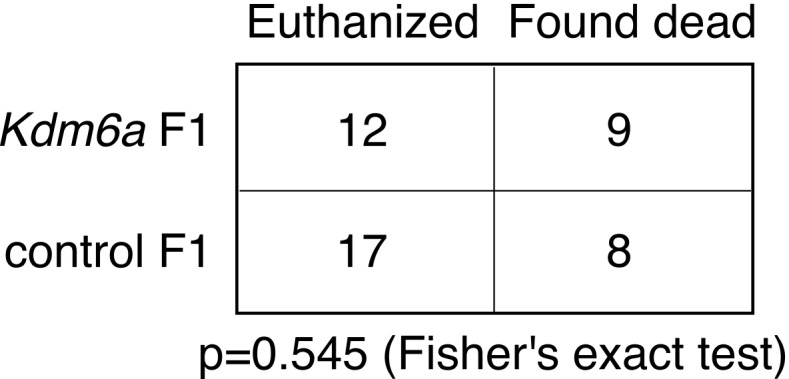
Figure 1—figure supplement 6. Utx F1 and control F1 weight and length.
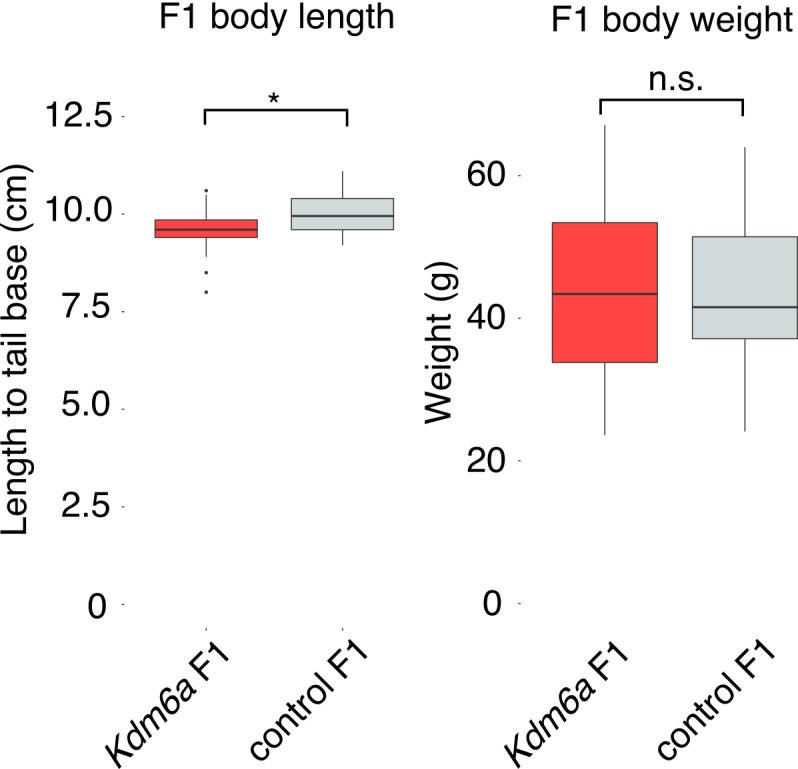
Figure 1—figure supplement 7. Counts of gross and histopathological diagnoses at necropsy for Kdm6a F1s and control F1s.
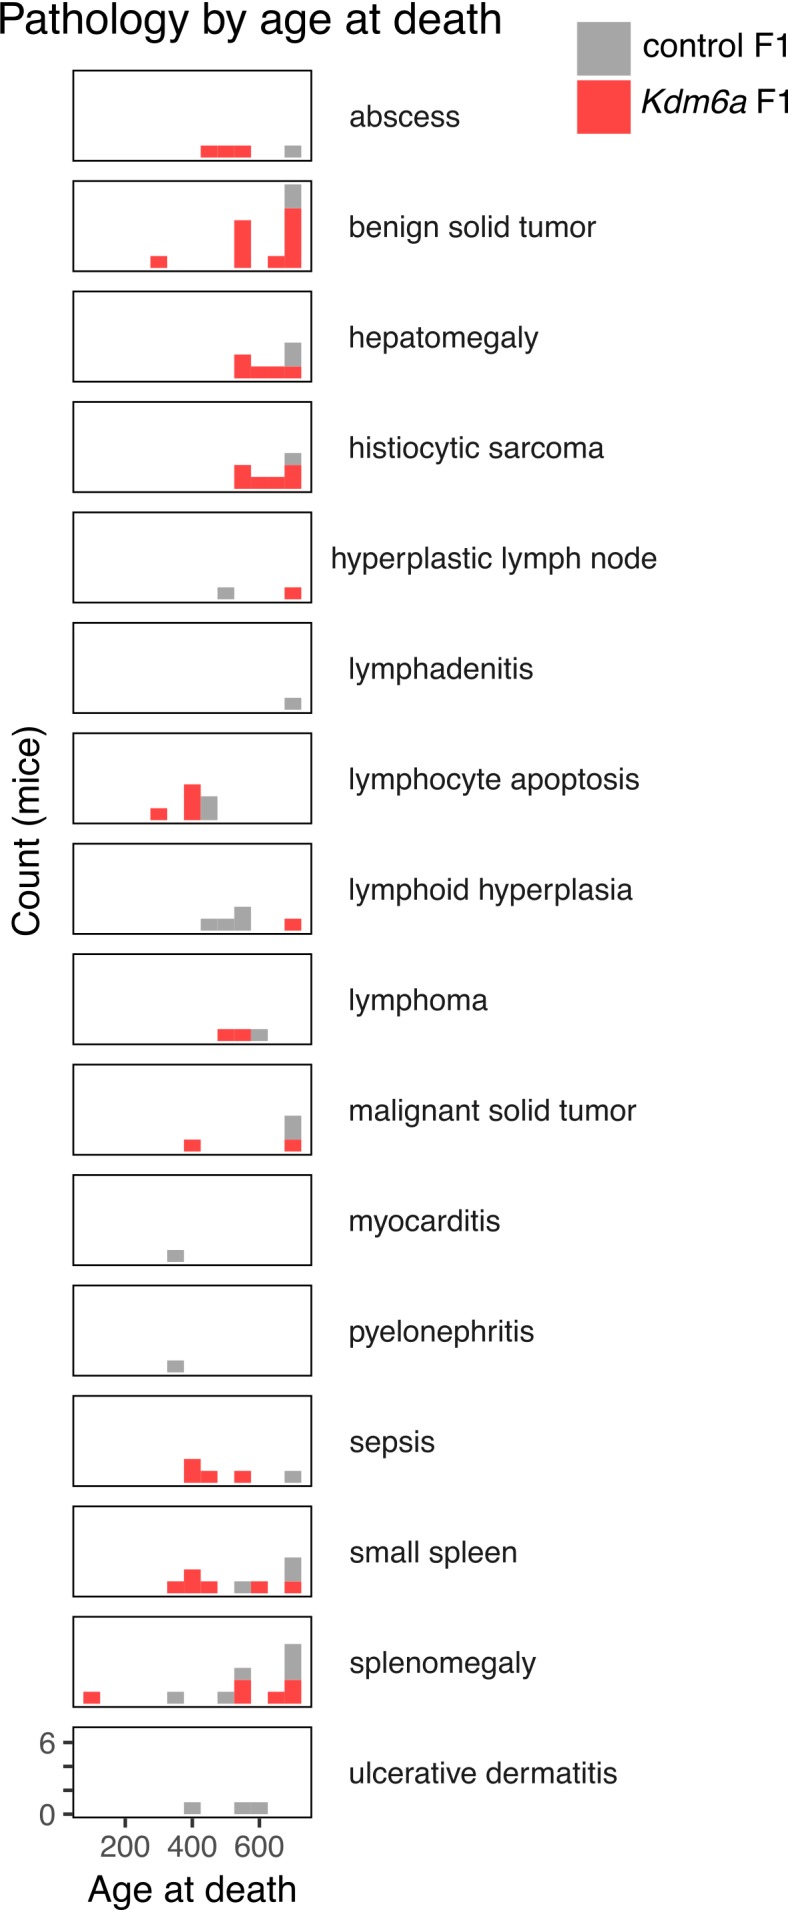
Figure 1—figure supplement 8. Tumor rates in control and Kdm6a F1s and F2s broken down by individual sire.

Figure 1—figure supplement 9. Characterization of myeloid lineages in F1 bone marrow.

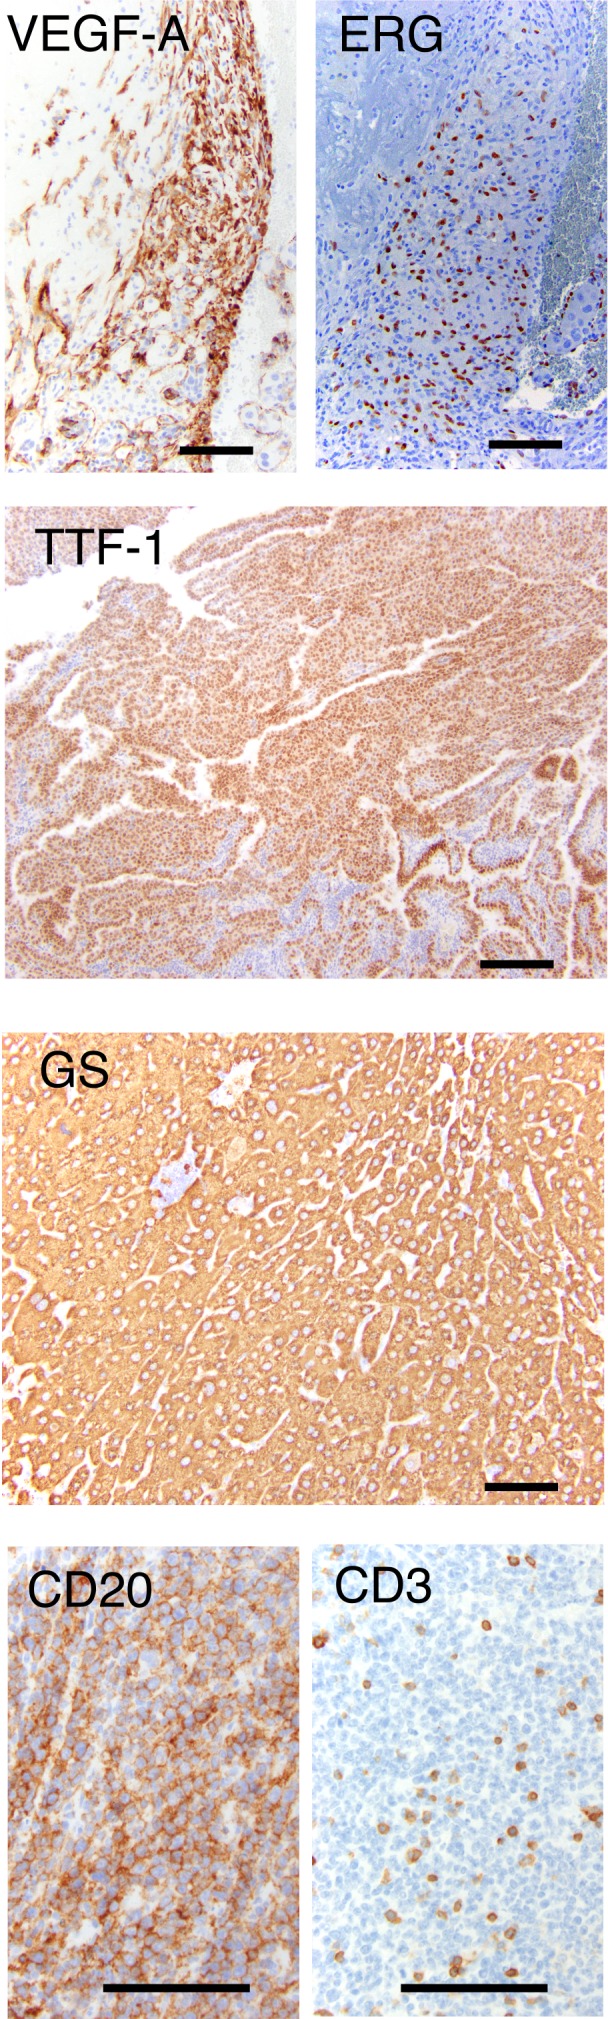
Figure 1—figure supplement 10. Validation of tumor types in Utx F1s.