Figure 2. Reduced lifespan and increased tumor incidence in Kdm6a F2s.
(A) Cross for Kdm6a F2s and control F2s. The Kdm6a cKO male used in this experiment was littermate to the 3 Kdm6a cKO and two control males used in the F1 experiment. Control F2s, combined progeny of Cre-only or only Kdm6a(fl)-only F1s. (B) Survival curve for Kdm6a F1s, control F1s, and Kdm6a F2s. Hazard ratio and p-value calculated by a Cox proportional hazards model. (C) Raw counts of tumors (p=3.45e-9) and non-tumor phenotypes (p=0.13) in control F1s, Kdm6a F1s, and Kdm6a F2s at necropsy (p-values, Kdm6a F2s vs. control F1s, one-sample test of proportions). (D) H&E staining of representative tumors in Kdm6a F2s. Scale bar, 100 um (large images), 10 um (insets). (E) Tumor count per individual at necropsy. *p<0.05, **p<0.01, Fisher’s exact test. (F) Fraction of mice with tumors. *p<0.05, **p<0.01, ***p<0.001, Fisher’s exact test. See Figure 2—source data 1.

Figure 2—figure supplement 1. Survival of F2s from individual sires.

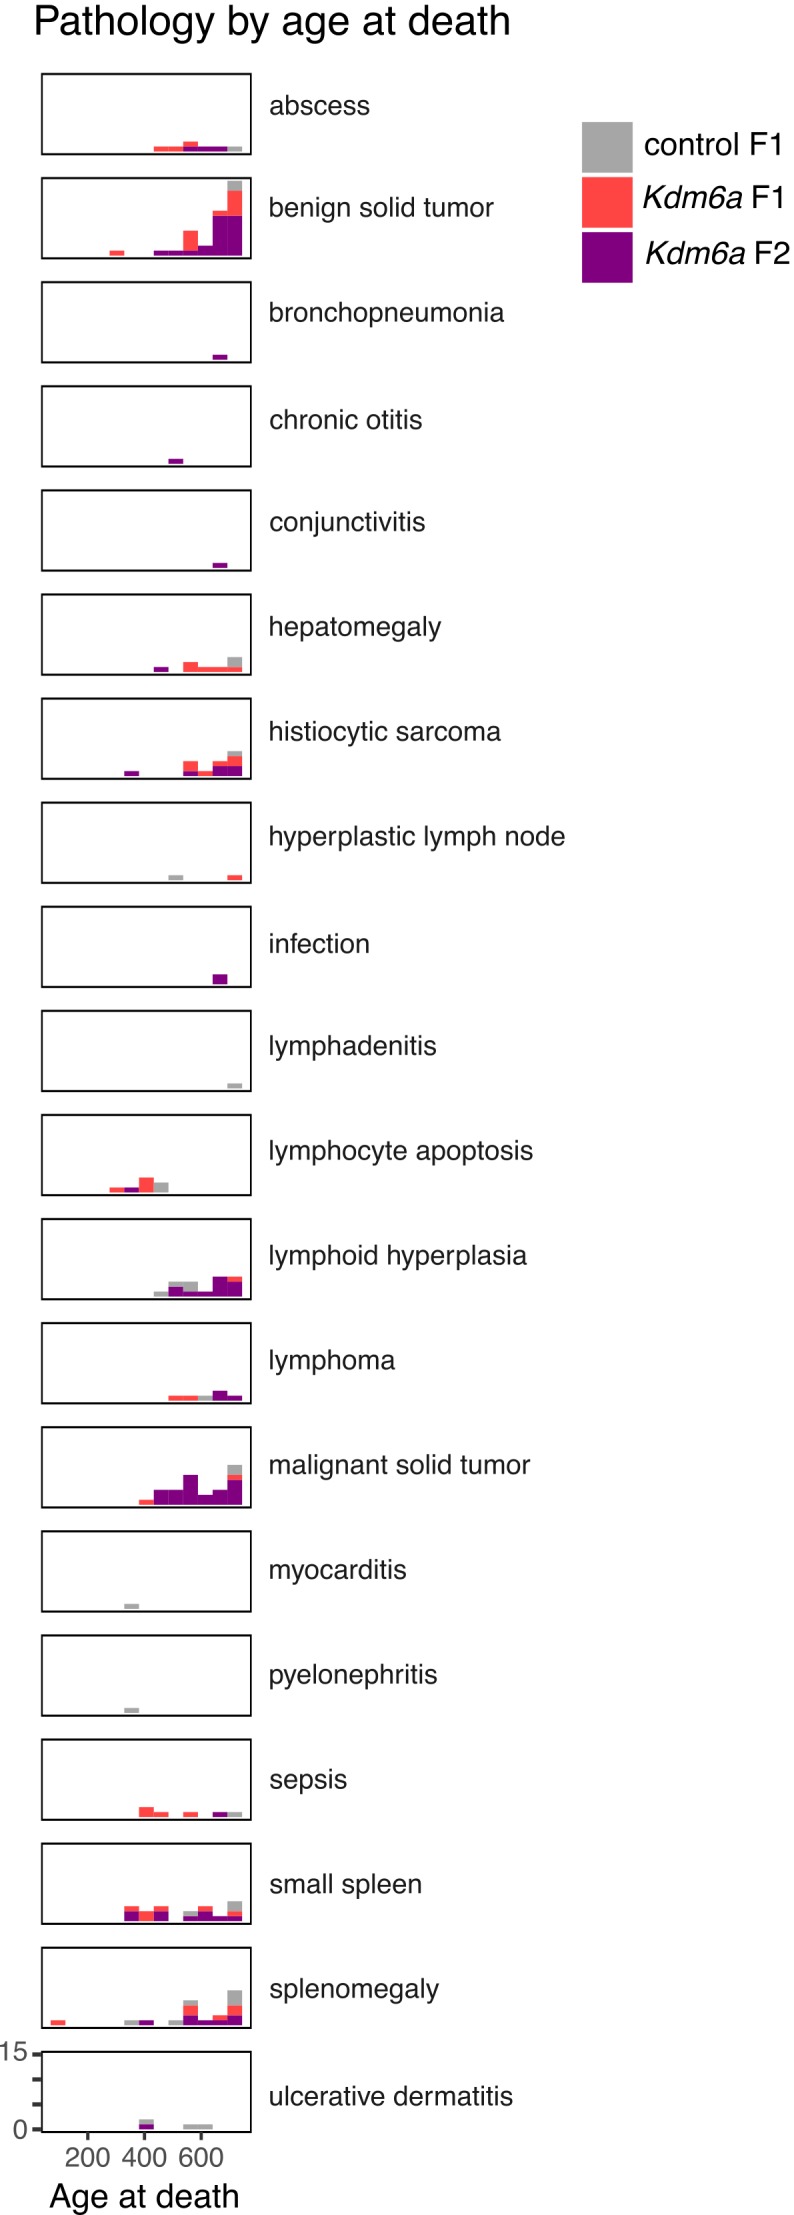
Figure 2—figure supplement 2. Counts of gross and histopathological diagnoses at necropsy for Kdm6a F1s, control F1s, and Kdm6a F2s.