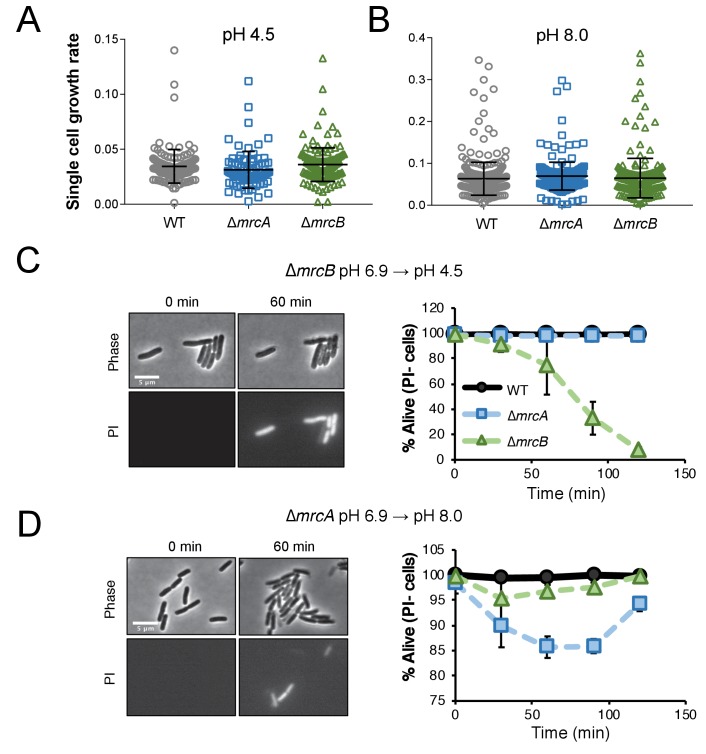
Figure 3. Cells defective for class A PBPs lyse upon exposure to non-permissive pH conditions.
(A–B) Single cell elongation rates for wild-type (MG1655), ∆mrcA (EAM543), and ∆mrcB (EAM546) cells during growth on agarose pads at pH 4.5 (A; n = 134, 81, and 155 cells) and pH 8.0 (B; n = 386, 257, and 246 cells). Rates were determined in the MATLAB-based program SuperSegger as described in the methods. Error bars represent SD. (C–D) Micrographs depicting representative images of propidium iodide incorporation in ∆mrcA (D, left) and ∆mrcB (C, left) mutants at t = 0 or 60 min post indicated pH shift. Scale bar represents 5 μm. Cell viability curves for wild-type, ∆mrcA (PBP1a), and ∆mrcB (PBP1b) strains after acidic (D, right) or alkaline pH (C, right) shift as indicated. Cell death was determined by uniform cytoplasmic staining with propidium iodide. Markers indicate mean percent viability ± SD of three biological replicates. Greater than 100 cells were analyzed for each strain at each time point per replicate.


