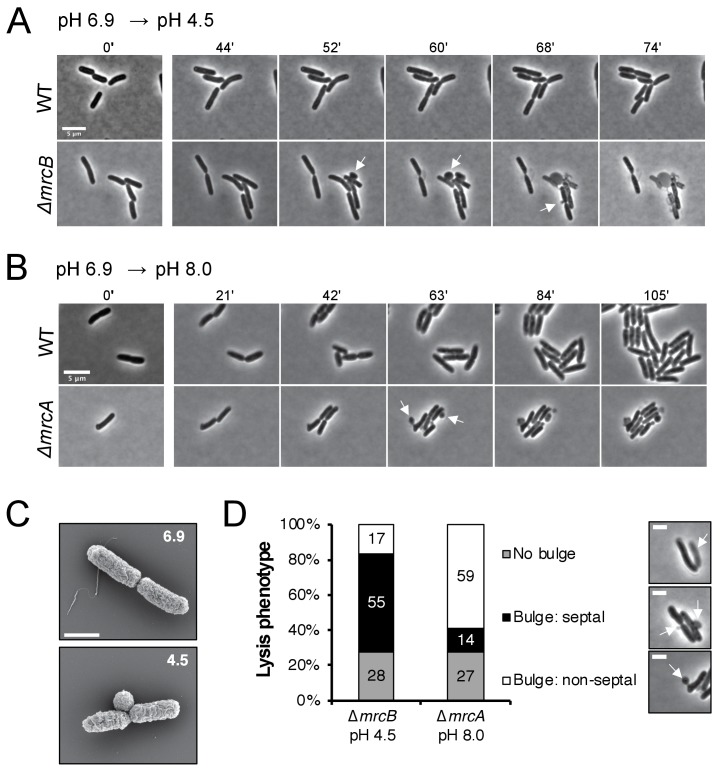
Figure 4. Distinct lytic phenotypes for cells defective for PBP1a and PBP1b upon pH shift.
(A–B) Representative phase contrast frames of time lapse imaging of ∆mrcB (PBP1b; EAM546) and ∆mrcA (PBP1a; EAM543) mutants upon acidic (A) or alkaline (B) pH shift, respectively, as compared to the parental strain (MG1655). White arrows indicate membrane bulges. Scale bar denotes 5 μm. Full videos can be viewed in Figure 4—videos 1 and 2. (C) Representative scanning electron microscopy micrographs for ∆mrcB (PBP1b; EAM546) mutant shifted to either pH 6.9 or pH 4.5 for two hours prior to fixation. Scale bar represents 1 μm. (D) Quantification of lysis phenotype between mutants. Lytic terminal phenotype was categorized into three groups: lysis via septal bulge, non-septal bulge, or no bulge. Determination of lytic phenotype was based on the frames preceding propidium iodide incorporation (time step = 3 min). Micrographs (top to bottom) depict representative images of no bulge, septal bulge, and non-septal bulge, respectively with arrows (scale bar = 2 μm). At least 50 cells across at least two independent biological replicates were assessed (ΔmrcA, n = 128; ΔmrcB, n = 278 cells). Bars are subdivided based on percent lytic phenotype in each mutant.

