. 2019 Apr 9;8:e40754. doi: 10.7554/eLife.40754

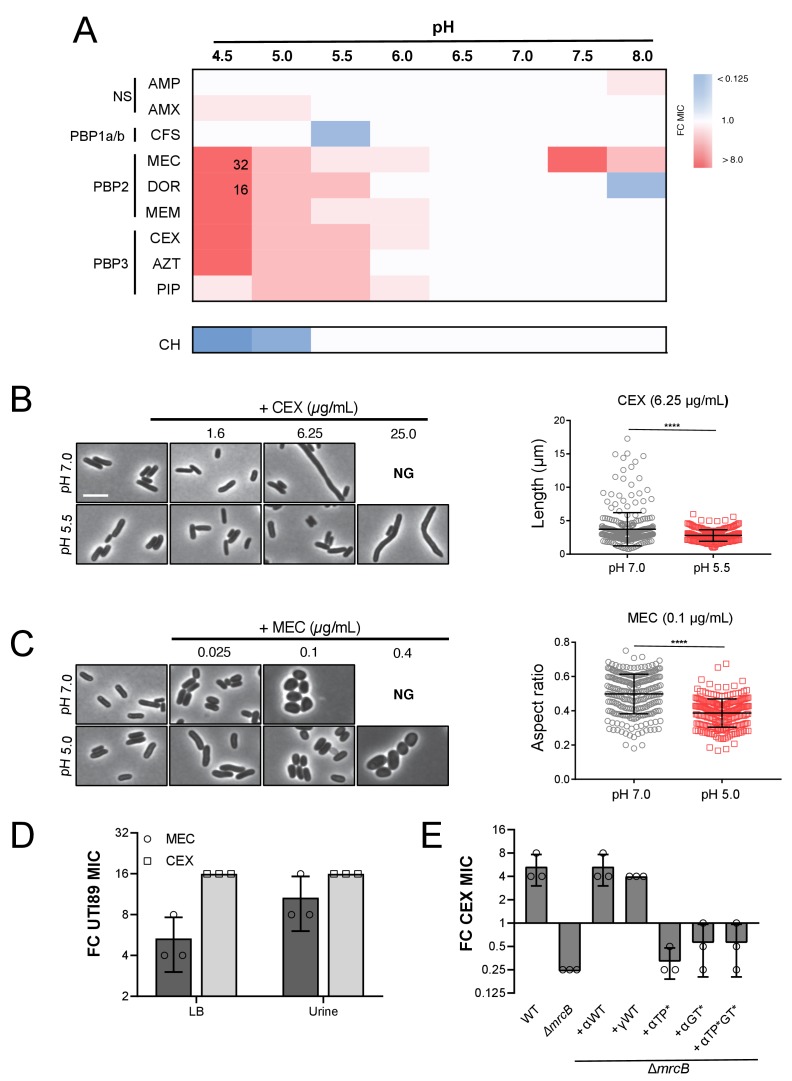
Figure 6. Intrinsic resistance to PBP2 and PBP3-targeting β-lactams at low pH.

(A) Heat map summarizing fold change in minimum inhibitory concentrations (MIC) of antibiotics for strain MG1655 cultured in LB (pH 4.5–8.0) after 20 hr. Cells in heat map are colored based on median fold change (FC) in MIC at indicated pH compared to pH 7.0 from at least three biological replicates. Fold change values of >8 are indicated in black inside relevant cell. Untransformed median MIC values can be viewed in Supplementary file 4. Abbreviations for antibiotic names are as follows: AMP, ampicillin; AMX, amoxicillin; CFS, cefsulodin; MEC, mecillinam; DOR, doripenem; MEM, meropenem; CEX, cephalexin; AZT, aztreonam; PIP, piperacillin; CH, chloramphenicol. Predominant cellular PBP target is indicated to the left. (B) Representative micrographs of cells treated with PBP3 inhibitor cephalexin (CEX) at pH 7.0 and pH 5.5. Distribution of cell lengths at sub-MIC concentration at pH 7.0 and 5.5 (n = 303 and 250) are shown to the right. (B) Representative micrographs of cells treated with PBP2 inhibitor mecillinam (MEC) cultured at pH 7.0 or pH 5.0. Distribution of cell aspect ratios (width/length) at sub-MIC concentration at pH 7.0 and 5.0 (n = 250 and 250) are shown to the right. For both panels A and B, scale bar indicates 3 μm, and NG denotes ‘no growth’ observed at the indicated concentration of antibiotic. Error bars represent SD. Significance was assessed by a Kruskal-Wallis test with asterisks denoting significance as follows: ****, p<0.0001. (D) Fold change in minimum inhibitory concentration of E. coli strain UTI89 to cephalexin (CEX) and mecillinam (MEC) grown at pH 5.0 compared to pH 7.0 in broth culture and in urine. Untransformed MIC values can be viewed in Supplementary file 4. (E) Fold change in minimum inhibitory concentration to cephalexin (CEX) for indicated strains grown at pH 5.5 compared to pH 7.0. EAM696 (ΔmrcB) derivatives producing PBP1b variants were grown in the presence of 10 μM IPTG. Untransformed MIC values can be viewed in Supplementary file 5. Bars represent mean fold change in minimum inhibitory concentration ± SD across at least three biological replicates.

Figure 6.

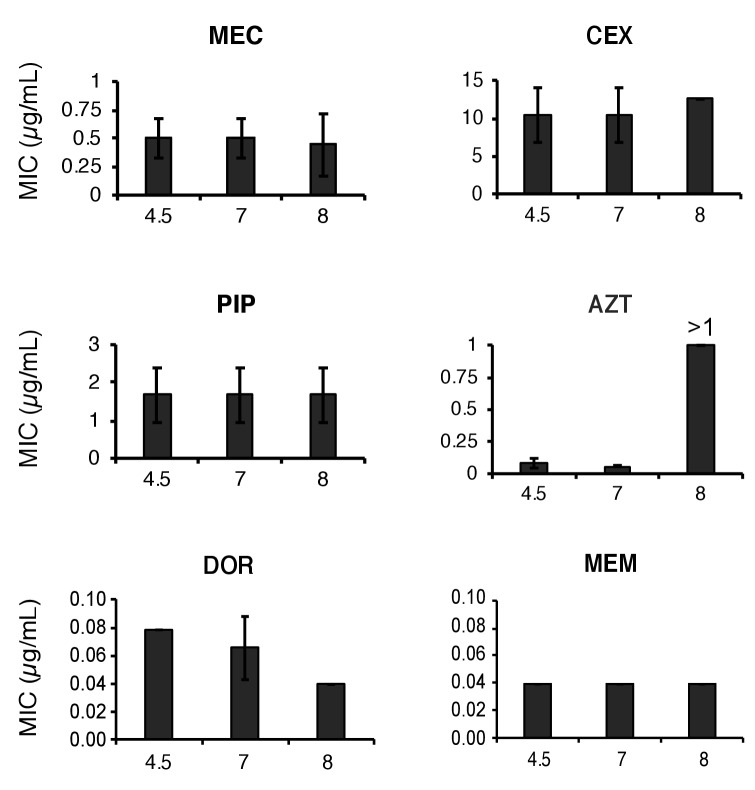
Figure 6—figure supplement 1. Stability of β-lactam antibiotics across pH values.

Figure 6—figure supplement 1.

Mecillinam (MEC), cephalexin (CEX), piperacillin (PIP), aztreonam (AZT), doripenem (DOR) and meropenem (MEM) were incubated in LB media at pH 4.5, 7.0, or 8.0 for 20 hr then inoculated into microtiter dishes with MG1655 for determination of the minimum inhibitory concentration as previously described. Bars represent mean minimum inhibitory concentration ± SD from at least three independent biological replicates. AZT was the only antibiotic to exhibit instability and only at pH 8.0.
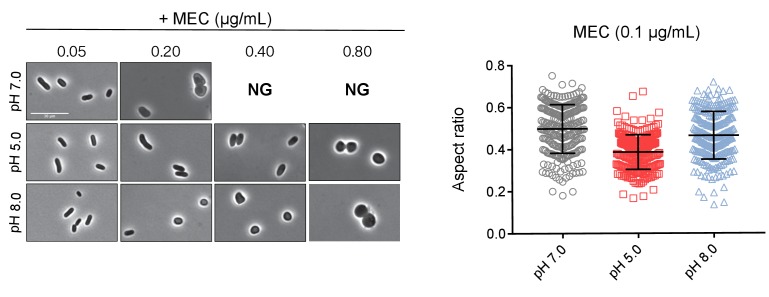
Figure 6—figure supplement 2. Mecillinam resistant cells at pH 8.0 remain rounded.

Figure 6—figure supplement 2.

Representative micrographs and aspect ratio (width/length) quantification of cells treated with PBP2 inhibitor mecillinam for twenty hours at pH 5.0, 7.0, and 8.0 (n = 250 for each group). Error bars indicate SD, and scale bar represents 10 μm.
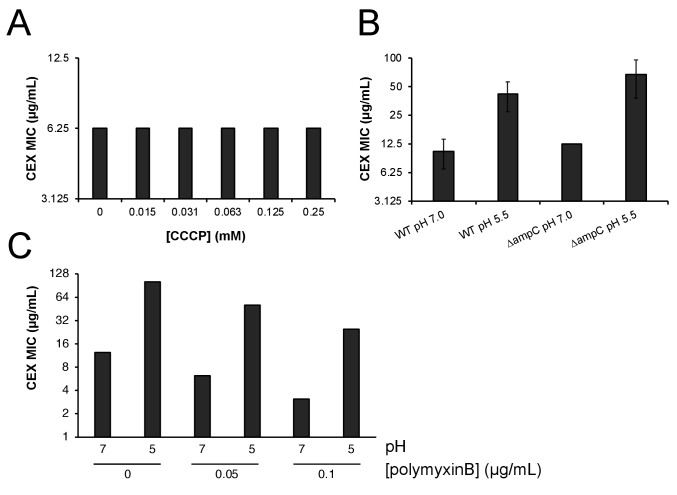
Figure 6—figure supplement 3. Proton motive force, AmpC β-lactamase, and outer membrane permeability do not confer pH-dependent resistance to cephalexin.

Figure 6—figure supplement 3.

(A) Minimum inhibitory concentration of cephalexin at pH 7.0 in the presence of various concentrations of proton motive force inhibitor carbonyl cyanide-m-chlorophenylhydrazone (CCCP). (B) Comparison of the minimum inhibitory concentration of cephalexin at pH 7.0 and pH 5.5 between wild type (MG1655) and ΔampC (EAM749) cells. Markers denote mean minimum inhibitory concentration ± SD deviation from three biological replicates. (C) Comparison of the minimum inhibitory concentration of cephalexin at pH 7.0 and pH 5.0 in wild type (MG1655) in the presence or absence of sub-growth inhibitory concentrations of pore-forming antibiotic polymyxin B.
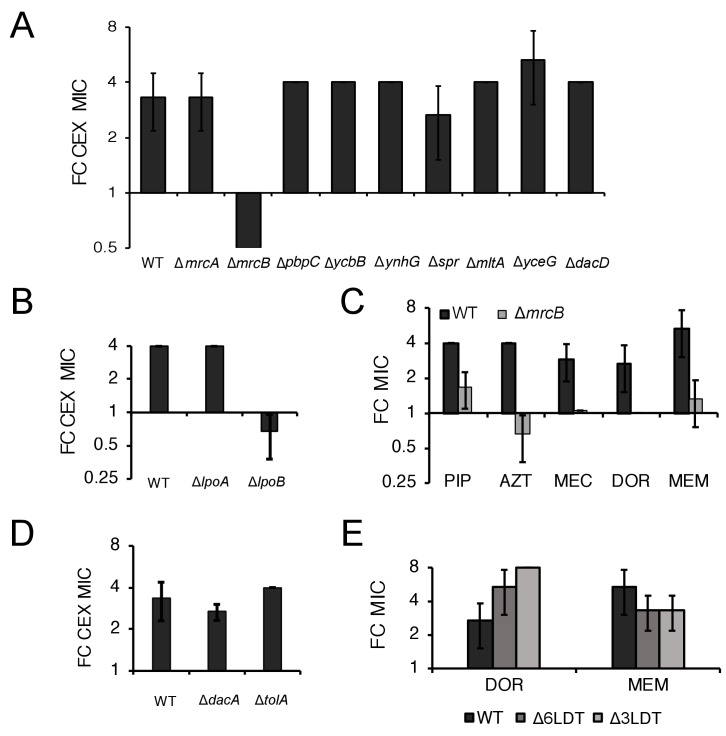
Figure 6—figure supplement 4. ΔmrcB abolishes low pH-dependent resistance independent of growth rate and β-lactam sensitivity.

Figure 6—figure supplement 4.

Comparison in the fold change in cephalexin (CEX) minimum inhibitory concentration of mutants in genes encoding nonessential transpeptidases and pH specialist autolysins (A) or lipoprotein activators (B) at pH 5.5 compared to pH 7.0. (C) Comparison of the fold change in minimum inhibitory concentration of piperacillin (PIP), aztreonam (AZT), mecillinam (MEC), doripenem (DOR), and meropenem (MEM) for wild type and ΔmrcB mutant cells at pH 5.0 compared to pH 7.0. (D) Comparison of the fold change in minimum inhibitory concentration of cephalexin (CEX) across wild type, ΔdacA, and ΔtolA cells at pH 5.5 compared to pH 7.0. (E) Comparison of the fold change in minimum inhibitory concentration of doripenem (DOR) and meropenem (MEM) in cells lacking three (EAM1152) or six LD-transpeptidases (BW25113∆6LDT) at pH 5.0 compared to pH 7.0. In all panels, bars represent mean minimum inhibitory concentration ± SD across three independent biological replicates.