. 2019 Apr 9;8:e44360. doi: 10.7554/eLife.44360

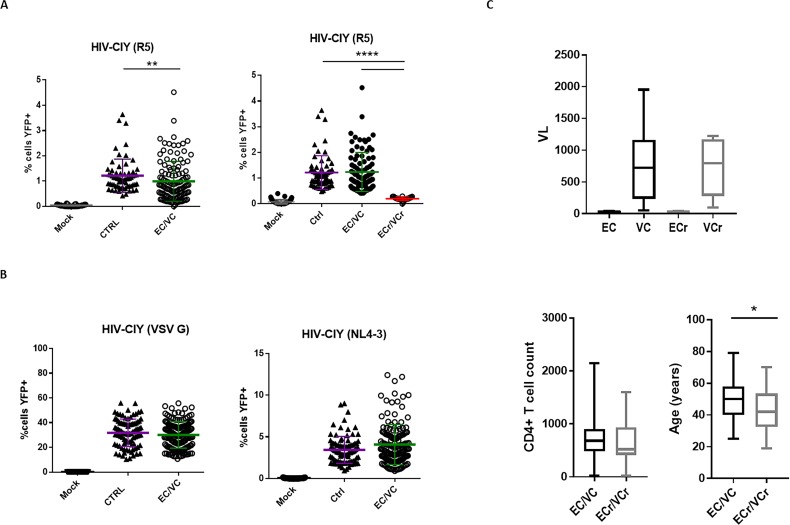
Figure 1. CD4 +T cell resistance to infection in prospective single cycle assay, specific to R5-tropic viruses in a subset of EC/VCs.

(A) Five-fold resistance to R5-tropic viruses in 16% of EC/VC (ECr/VCr) infected using replication defective HIV-cycT1-IRES-eYFP (CIY) with R5-tropic envelopes YU2 and ADA. A > 95% power was determined based on comparisons of means using PASS statistical software between ECr/VCr and all other groups (Ctrl and EC/VC). (B) Equivalent susceptibility to both X4-tropic (NL4-3) and VSV G pseudoviral particles in ECr/VCr. A and B are pooled results from different experiments with samples tested at least in triplicate (Ctrl n = 35, EC/VC n = 38, representative from the initial population (Figure 1—figure supplement 1) and selected based upon specimen availability, and ECr/VCr (n = 21). (C) Comparable levels of chemokines (MIP-1α and MIP-1β) in cell culture supernatants from activated CD4 +T cells, measured by ELISA. (D) CD4 +T cells from Ctrl were exposed to cell culture supernatants from activated T cells of Ctrl and EC/VC with or without the resistance phenotype, in the presence of HIV particles pseudotyped with YU2 or VSV G. C and D are pooled results from different experiments with n = 10 (Ctrl and EC/VCs) and n = 21 (ECr/VCr). Shown are individual values with Means ± Standard Deviation (SD). Data were analyzed by using the Kruskal-Wallis test and Dunn’s multiple-comparison test. *p<0.05; ****p<0.0001.

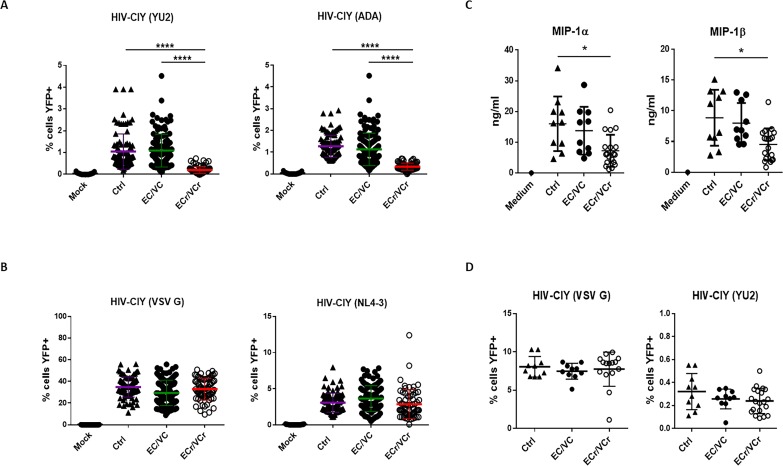
Figure 1.

Figure 1—figure supplement 1. Initial testing showing CD4 +T cell resistance to infection in single-cycle pseudotyping assay, specific to R5-tropic viruses, in a subset of EC/VCs.

Figure 1—figure supplement 1.

(A) Left panel shows relative resistance to R5-tropic viruses in EC/VC compared to Ctrl, infected with replication-defective HIV-CIY pseudotyped with R5-tropic envelope ADA. EC/VC (n = 131) and Ctrl (n = 35) tested in duplicate (80% power was determined based on comparisons between groups). Right panel shows resistance to R5-tropic viruses in a subset of EC/VC (ECr/VCr, 21/131 or 16%) compared to Ctrl after separated out from the remaining EC/VC. These 21 ECr/VCr were identified as resistant based upon the % eYFP +cells being lower than that of the Ctrl group and confirmed after additional retesting using two R5 envelopes in triplicate (data shown in Figure 1). (B) Equivalent susceptibility to both VSV G and X4-tropic (NL4-3) pseudoviral particles between groups in all samples analyzed. Data were analyzed by using the Kruskal-Wallis test and Dunn’s multiple-comparison test. **p<0.01; ***p<0.001; ****p<0.0001. (C) Clinical data in EC/VC population. Comparable Viral Load (VL) and CD4 +T cell counts between EC and VC with or without the resistance phenotype to R5-tropic viruses. Age (years) at the time of the diagnosis to HIV between EC/VC (n = 109) and ECr/VCr (n = 21). Data presented as box and whisker plots. Statistical analysis was performed by using the U-Mann Whitney test; *p<0.05.
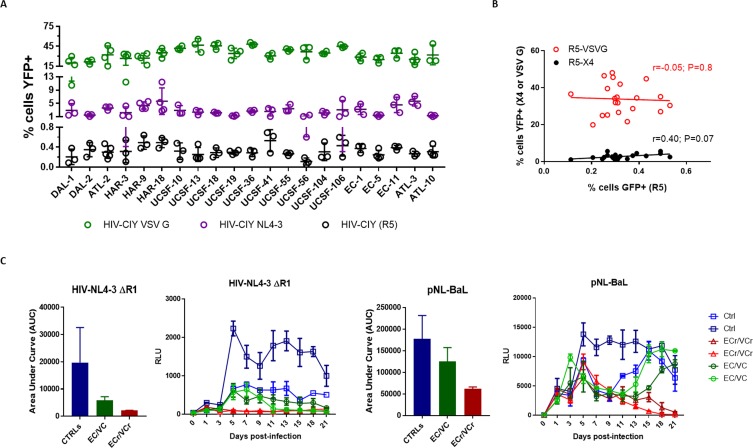
Figure 1—figure supplement 2. CD4 +T cell resistance to infection in single-cycle pseudotyping assays in 21 ECr/VCr and multi-cycle infection in a subset of ECr/VCr, Ctrl and EC/VC.

Figure 1—figure supplement 2.

(A) Susceptibility to R5-, X4-, and pan-tropic virus in all 21 ECr/VCr, using single cycle infection. (B) Virus susceptibility correlations in all 21 ECr/VCr. (C) Replication kinetics using replication-competent HIV-NL4-3ΔR1 and pNL-BaL. Supernatants from CD4 +T cells infected with HIV-NL4-3ΔR1 (0.01 ml) and pNL-Bal (0.001 ml) were harvested every other day for 21 days and use to infect TZM-bl targets. Shown is a representative experiment out of 2 performed, with n = 2 per group, tested in triplicate and quantified as Relative Light Units (RLU) using luciferase assay with Means ± SD. ECr/VCr T cells were still fully viable at the end of the 3 week period, with no evidence of cytotoxicity. Differences were analyzed using AUC, with Means ± SD.