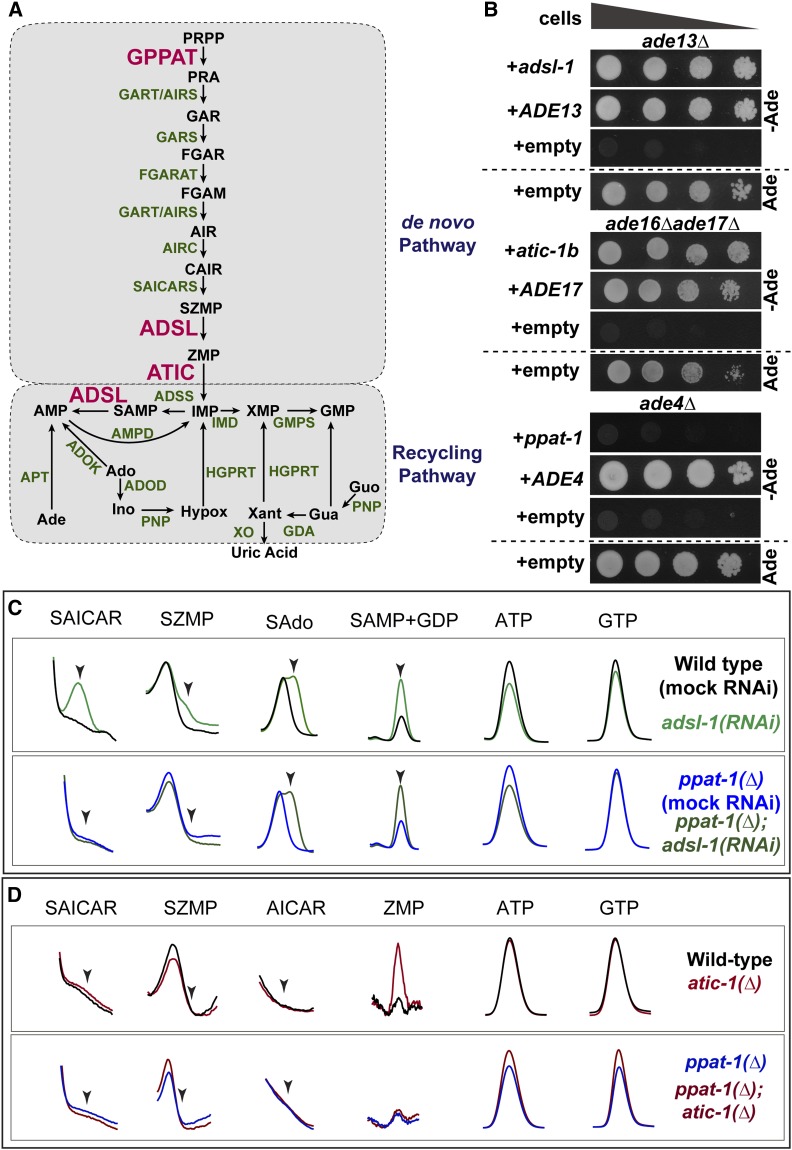
Figure 1.
Purine metabolism in C. elegans. (A) Schematics of the purine biosynthesis pathways in C. elegans based on sequence homology. Enzymes subjected to functional analysis are represented in red, other enzymes in green, and metabolites in black. (B) Drop test to assess adenine auxotrophy in yeast S. cerevisiae mutants deficient for enzymes ADSL (ade13∆), ATIC (ade16∆ ade17∆), or GPPAT (ade4∆) expressing C. elegans genes adsl-1, atic-1b and ppat-1, respectively. Expression of S. cerevisiae genes ADE13, ADE17, and ADE4 was used as positive control, and expression vector without insert as negative control. A culture with adenine is shown as auxotrophy control. In all drop tests presented, four drops are shown per condition, corresponding to serial dilutions (1:10) of cellular suspensions, with deceasing cell concentrations from left to right. (C) Zoom in on HPLC chromatogram peaks of specific metabolites SAICAR (SZMP riboside form), SZMP, sAdo (succinyl-adenosine, SAMP riboside form), SAMP, ATP, and GTP, upon adsl-1(RNAi) and ppat-1(∆); adsl-1(RNAi). (D) Zoom in on HPLC chromatogram peaks of specific metabolites SAICAR (SZMP riboside form), SZMP, AICAR (ZMP riboside form), ZMP, ATP, and GTP, in atic-1(∆) and ppat-1(∆); atic-1(∆). Ade, adenine; Ado, adenosine; SAdo, succinyl-adenosine; Ino, Inosine; Hypox, hypoxantine; Xant, Xantine; Gua, guanine; Guo, guanosine. In (C) and (D), scales are adjusted differently among metabolites, in order to highlight differences between genotypes.

