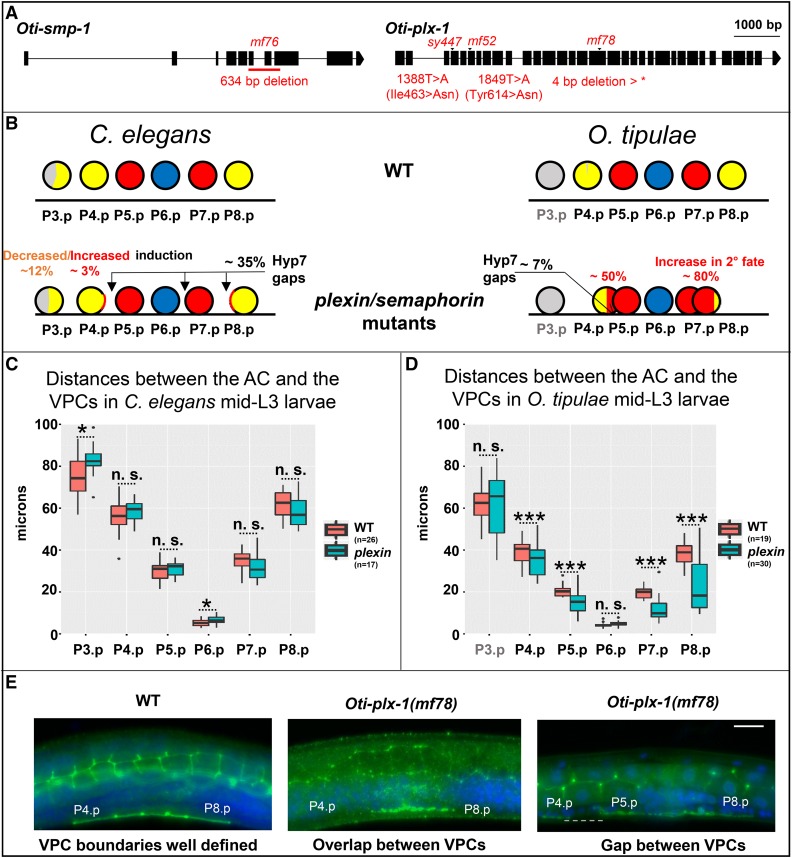
Figure 4 .
O. tipulae plexin/semaphorin mutants present defects in vulval induction and closer VPC cells. (A) Gene models of Oti-smp-1 and Oti-plx-1 with their respective mutations in O. tipulae. (B) Schematic depiction of the phenotypic effects of plexin/semaphorin mutants in C. elegans and O. tipulae on the induction and localization of Pn.p cells. Quantifications can be found in Table S4. In C. elegans, the percentages shown are the highest found along alleles, namely those in plx-1(ev724) mutants. Arrows show the most common localization of intercellular spaces (gaps) between VPCs. Each VPC diagram (circle) is colored according to the frequency of its acquired fate (yellow, red, and blue for the 3°, 2°, and 1° fates, respectively, and gray for undivided). Data from Dichtel-Danjoy and Félix (2004b). (C) Normalized distances between the AC and the VPCs in C. elegans WT and plx-1(ev724) animals at the mid-L3 stage after DU division. Only the distances between the AC and P3.p, and P6.p, are significantly larger in plx-1 mutants compared to WT (Wilcoxon rank sum test, P < 0.05). (D) Normalized distances between the AC and the VPCs in O. tipulae WT and Oti-plx-1(mf78) animals at the mid-L3 stage after DU division. Distances between each of P(4–8).p and the AC, except for P6.p, are all significantly smaller in Oti-plx-1(mf78) mutants relative to WT (Wilcoxon rank sum test, with P-values < 10−4). (E) Immunostaining of cell junctions with MH27 antibody (in green), with DAPI staining in blue. The central panel shows overlapping VPCs, while the right panel shows a rare instance of a gap (dotted line) in Oti-plx-1(mf78) animals. All the images are set to the same scale. Bar, 10 μm. Anterior is to the left in all images, and the ventral side is down. AC, anchor cell; n.s., not significant; VPC, vulval precursor cell; WT, wild-type; *: p<0.05; ***: p<0.001.

