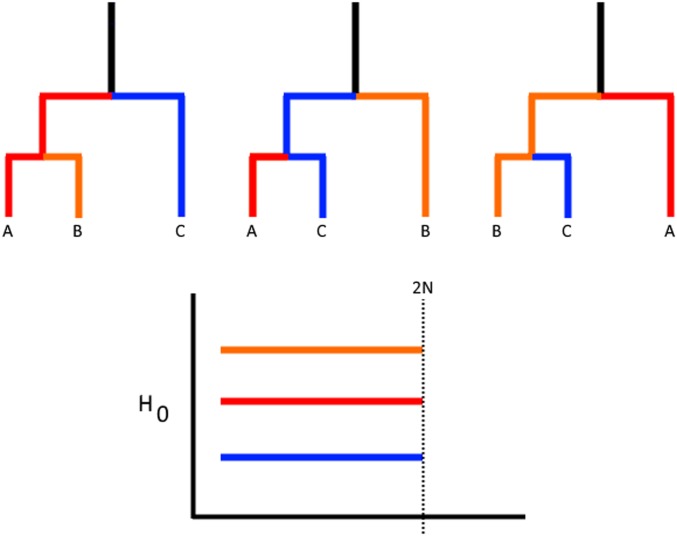
Figure 2.
By averaging over multiple genealogies, the barcode of features approaches identical bars of length equal to the expected pairwise coalescence time. (a) The C̆ech complex for these points at the drawn radius is a graph with a cycle (shown with the dotted lines), as the triple intersection is empty. (b) An ARG with lineage b inheriting p proportion of its genome from the lineage leading to a.

