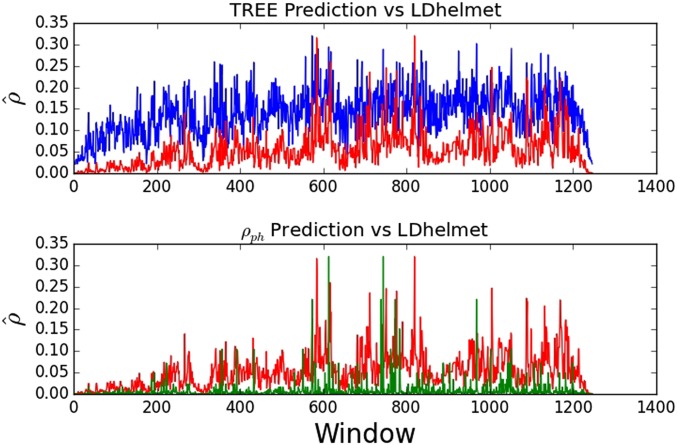
Figure 9.
Relative accuracy of TREE and Camara’s with respect to LDhelmet. The blue line plot represents TREE, the red represents LDhelmet, and the green in the second panel represents . Because suggests orders of magnitude more rate variation than LDHelmet, we rescale the estimate given by to the exact range of LDHelmet. For TREE, we only multiply by a uniform window length conversion factor of .

