Figure 4.
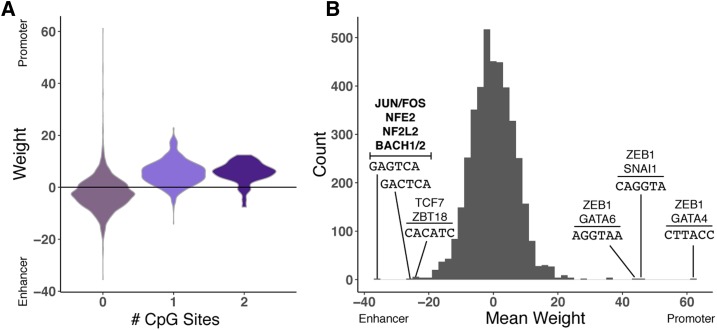
Interpreting the weights assigned to 6-mers by the promoter vs. enhancer classifier. (A) The distribution of weights assigned to 6-mers by the promoter vs. enhancer classifier (Figure 1), stratified by the number of CpG sites in the 6-mer. Each 6-mer is represented by its mean weight across classifiers trained on nine nonoverlapping subsets of the regions. Positive weights indicate that the 6-mer is predictive of promoter activity, and negative weights are indicative of enhancer activity. (B) The distribution of mean 6-mer weights. The 6-mers with the highest and lowest weights are labeled with their sequences and matches to transcription factor motifs from the HOCOMOCO v11 CORE database. Significant matches after multiple testing correction (false discovery ratio < 0.05) are shown in bold; for high-weight 6-mers without matches that meet this threshold, the top two nominally significant (P < 0.05) matches are listed. The top enhancer-associated 6-mers match motifs associated with components of AP-1 (JUN and FOS) and several other families. There were no significant matches for the promoter-associated 6-mers after multiple testing correction, but all contain the GGTA sequence, and nominally match ZEB1 and GATA factor motifs. CGI-stratified analyses are provided in Figure S10. CGI, CpG island.

