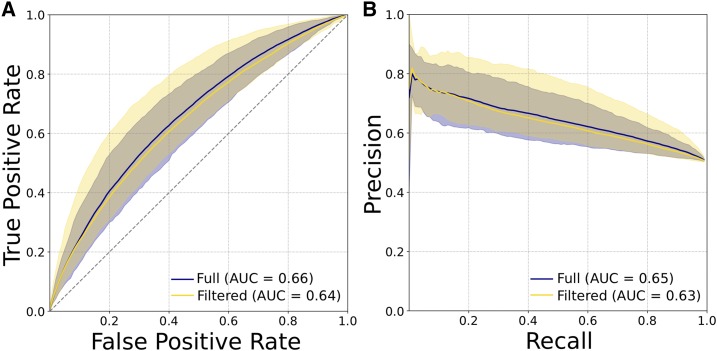
Figure 6.
Enhancers and promoters defined by histone marks (H3K27ac with or without H3K4me1) from the Roadmap Epigenomics Project are less distinguishable by short sequence patterns than those defined by transcription patterns by FANTOM. (A) ROC curves and (B) PR curves evaluating SVM classifiers trained to distinguish promoters from enhancers using patterns of 6-mers as features. Plots show the mean, maximum, and minimum curves obtained from classifiers trained and evaluated on nine unique subsets of 4000 promoters and enhancers from the full data sets. The two curves on each plot represent an analysis of all enhancers and promoters, or a set with regions that have enhancer activity in some cellular contexts and promoter activity in others removed. Promoters and enhancers identified by bidirectional transcription via cap analysis of gene expression assays were much easier to distinguish from sequence patterns (Figure 1, A and B). AUC, area under the curve; PR, precision recall; ROC, receiver operator characteristic; SVM, support vector machine.

