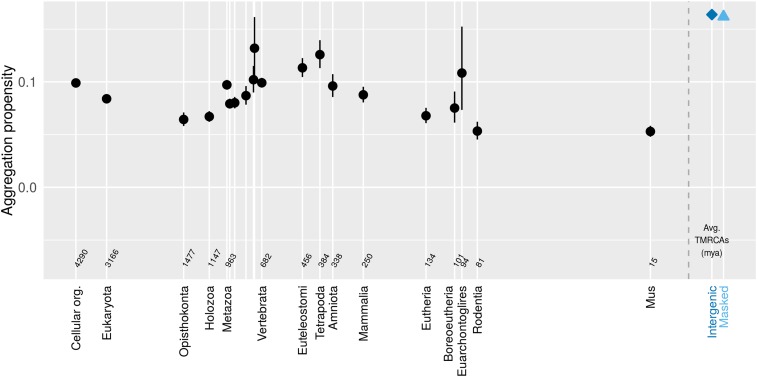
Figure 2.
Mouse genes show little pattern in aggregation propensity (assessed via TANGO) as a function of age. Genes (black) show less aggregation propensity than intergenic controls (blue). Back-transformed central tendency estimates ± 1 SE come from a linear mixed model applied to transformed data, where gene family and phylostratum are random and fixed terms, respectively. Importantly, this means that we do not treat genes as independent data points, but instead take into account phylogenetic confounding, and use gene families as independent data points. Times to most recent common ancestor (TMRCAs) for most phylostrata were taken from TimeTree.org (Kumar et al. 2017) on February 18, 2016 and that for M. pahari was taken May 7, 2018. We used the arithmetic means of the TMRCAs of the focal taxon shown on the x-axis and the preceding taxon (i.e., the estimated midpoint of the interior branch of the tree). Cellular organism age is shown as the midpoint of the last universal common ancestor and the last eukaryotic common ancestor. Taxon names, some of which are omitted for space reasons, follow the sequence Metazoa, Eumetazoa, Bilateria, Deuterostomia, Chordata, Olfactores, Vertebrata, Euteleostomi, Tetrapoda, Amniota, Mammalia, Eutheria, Boreoeutheria, Euarchontoglires, Rodentia, Mus. The gray dashed line shows the 0 time, with control sequences to the right of it.

