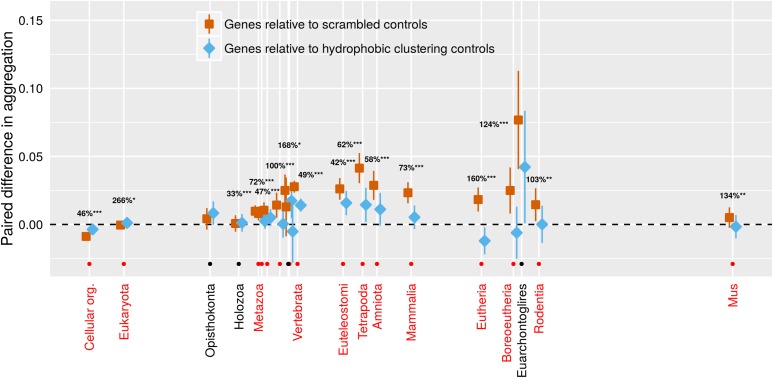
Figure 4.
Only very old genes have aggregation propensities lower than that expected from their amino acid composition alone (orange < dashed line expectation of 0). This puzzling finding is reduced when we account for clustering (blue is closer than orange is to the 0 dashed line) using a scrambled sequence that is controlled to have a similar clustering value. The clustering of hydrophobic amino acids in young genes acts to increase their aggregation propensity. 95% confidence intervals are shown, based on a linear mixed model where gene family and phylostratum are random and fixed terms, respectively. Note that blue and orange confidence intervals should be compared only to the reference value of zero, and not to each other, due to the paired nature of the data. For phylostrata shown in red and indicated by an orange dot, the difference between blue and orange was significant (* P < 0.01, ** P < 0.001, *** P < 0.0001), and the percentage of deviation from 0 accounted for by the control is shown. For most phylostrata where the difference between blue and orange was nonsignificant (indicated by a black dot and black text), the orange deviated little from 0, so there was little or nothing for the blue clustering control to account for. Results are shown for TANGO; results for Waltz trend in the same direction but are weaker (Figure S5). Orange values come from the mean of 50 scrambled sequences per gene, blue from a single scrambled sequence with a closely matched clustering value. The x-axis is the same as for Figure 2.

