Figure 3.

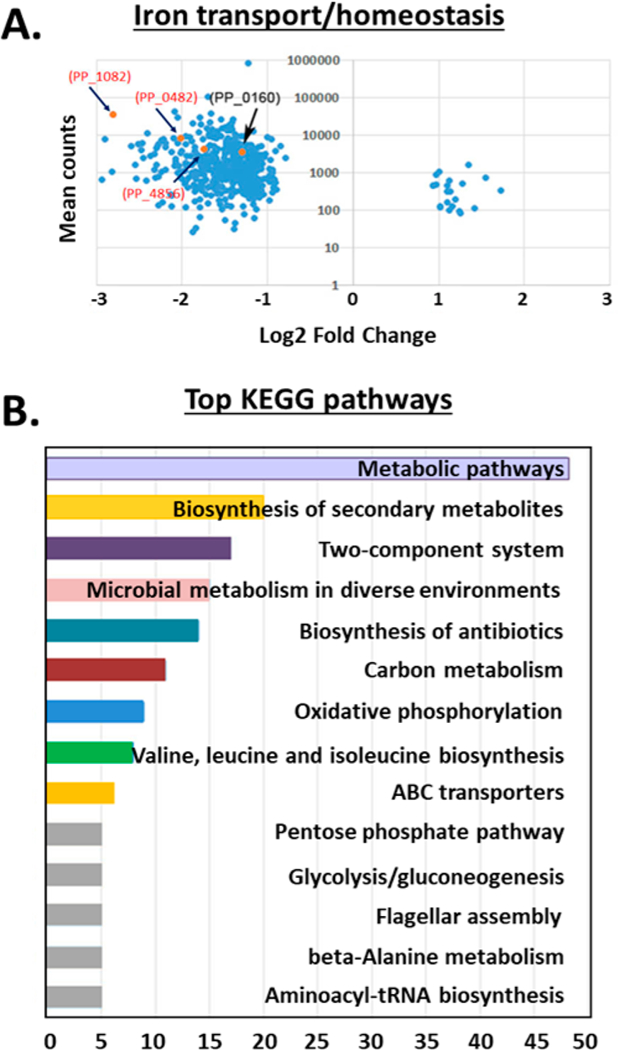
(A) Volcano plots showing the mean counts (y axis) and fold change (log 2, x axis) of genes involved in iron transport. Points colored orange indicate those genes predicted to encode proteins involved in iron binding, iron transport, or iron homeostasis. (B) KEGG pathway analysis representing the breakdown of biological pathways identified in promysalin-treated cells on the basis of their putative functions, assigned using protein function databases. For each KEGG pathway, the bar shows the fold enrichment of the pathway. Analysis was performed by a Fisher exact test. Significantly enriched KEGG pathways (p < 0.05) are presented.
