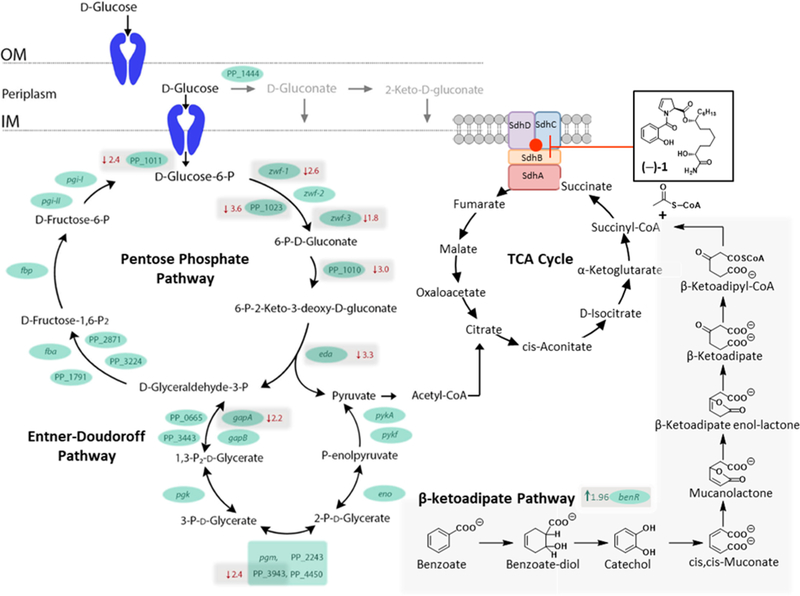
Figure 4.

Representation of glucose catabolism in PPKT2440. Shown are reactions that take place in the periplasmic space as well as the catabolic reactions that take place in the cytoplasm. (Blue cartoons represent membrane transporters.) The genes encoding the enzymes involved in each of the steps are indicated. OM represents the outer membrane; IM represents the inner membrane. If a gene demonstrated differential expression between PPKT2440 cells treated with promysalin and those treated with DMSO (control), then the fold change is indicated in red. Arrows beside the fold change indicate the direction of fold change.
