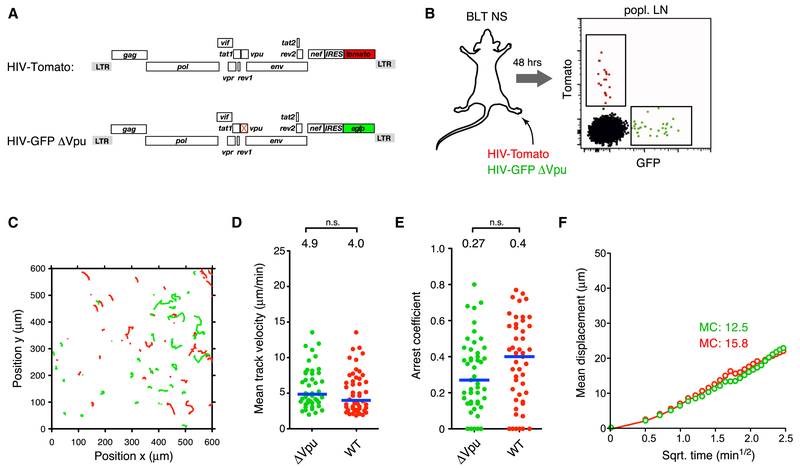
Figure 2: Vpu does not attenuate migration of HIV-infected T cells in LNs.
(A) ORF diagrams of indicated HIV reporter strains
(B) Infected cells in draining popLN 2 days following footpad co-injection of both reporter strains.
(C) Migratory tracks,
(D) Mean track velocities,
(E) Arrest coefficients, and
(F) MD plot of HIV-infected cells.
Blue lines and numbers above graphs indicated medians. MC = motility coefficient (in μm × min−1). n.s. = not significant.

