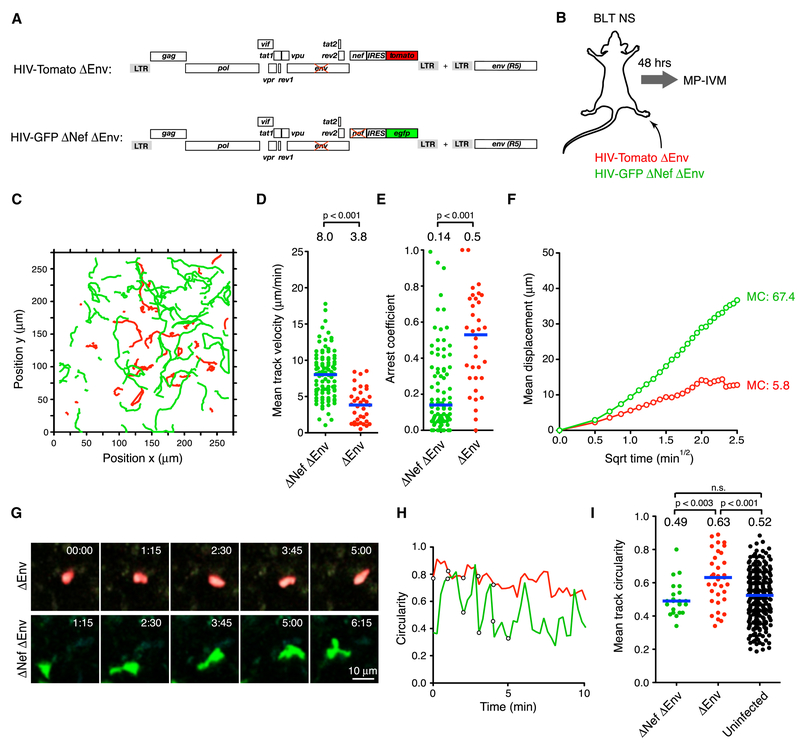
Figure 3: Nef impairs stabilization of cell polarity in HIV-infected T cells.
(A) ORF diagrams of indicated HIV reporter strains. To produce virus capable of one round of infection, a complementary helper plasmid encoding intact env was used for viral packaging.
(B) Experimental protocol
(C) Migratory tracks,
(D) Mean track velocities,
(E) Arrest coefficients and
(F) MD plots of HIV-infected cells. Blue lines and numbers indicate medians. MC = motility coefficient (in ×m × min−1).
(G) MP-IVM time-lapse series of representative T cells infected with env-deficient HIV expressing Nef (red) or not (green). Elapsed time in minutes:seconds.
(H) Circularity index over time for cells shown in (G). Circles correspond to measurements of cells at various time points depicted in (G).
(I) Mean track circularities.
Data are pooled from 6 individual recordings from 2 animals. MC = motility coefficient (in μm × min−1). n.s. = not significant. Blue lines and numbers above graphs indicate medians. n.s. = not significant.

