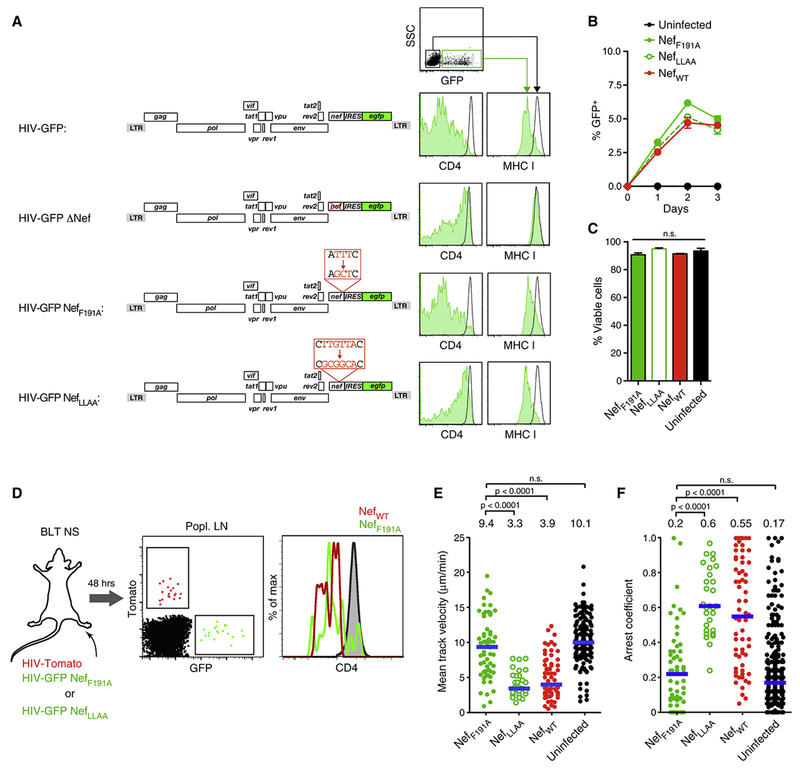
Figure 4: Nef interferes with cell migration by activating PAK2.
(A) Cell surface expression of CD4 and MHC I on uninfected TCM (black histograms) or TCM infected with HIV-GFP encoding either wildtype Nef, ΔNef, NefF191A or NefLLAA (green histograms).
(B) Frequency of infected T cells.
(C) Frequency of viable (Annexin V−) infected cells on day two.
(D) Exp. protocol and CD4 expression by infected cells in draining popLNs 2 days following footpad co-injection of WT and F191A mutant reporter strains. Grey histogram shows uninfected LN CD4+ T cells.
(E) Mean track velocities and
(F) Arrest coefficients of HIV infected T cells. Uninfected TCM recorded in LNs of separate BLT NS mice are shown for reference. Data are pooled from 17 individual recordings from 5 animals. Blue lines and numbers above graphs indicate medians. n.s. = not significant.

