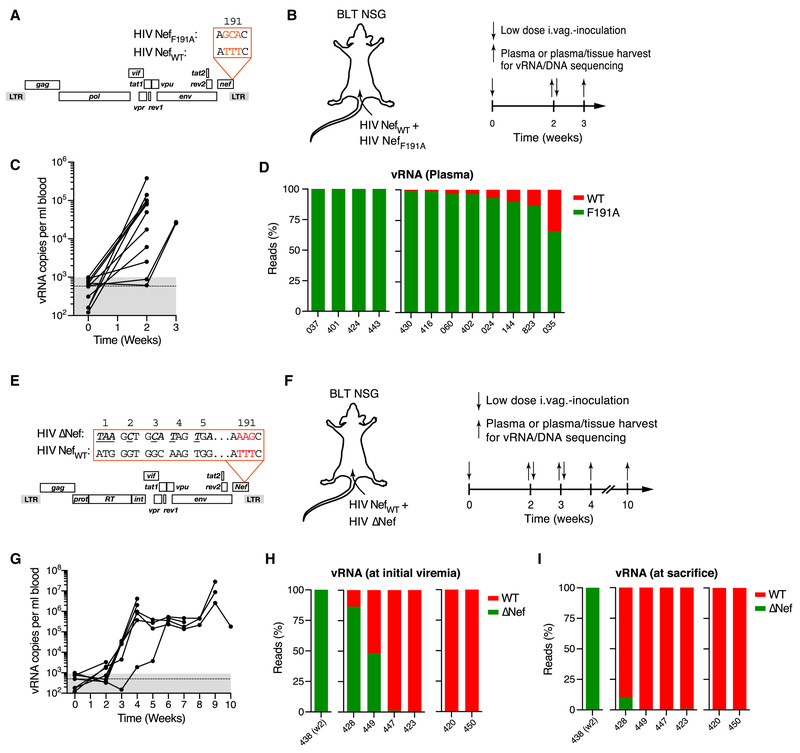
Figure 6: Actin cytoskeletal disruption restrains initial viral dissemination.
(A) ORF diagrams of HIV NefWT and HIV NefF191A.
(B) 104 IUs each of each clone were intravaginally co-inoculated into BLT NSG mice at 50:50 ratio (based on I.U.). Plasma viremia was measured at week two, followed the next day by tissue harvest or, in non-viremic animals, repeat intravaginal inoculation and tissue harvest at week three.
(C) Plasma viremia. Dashed line and grey-shaded area indicate mean and range of background signals in three uninfected control animals.
(D) Ratio of nefWT (red) or nefF191A (green) NGS reads (~2 × 10⁴ total reads/sample) from plasma vRNA obtained at the time of initial viremia. Numbers indicate individual animals. HIV nefWT vRNA was undetectable at any time in plasma or any tissue analyzed in the four animals grouped on the left.
(E) ORF diagrams of HIV NefWT and HIV ΔNef.
(F) 104 IUs each of HIV NefWT and HIV ΔNef were intravaginally inoculated into BLT NSG mice at 50:50 ratio (based on I.U.). Plasma viremia was measured weekly starting at week 2. Non-viremic animals received repeat intravaginal inoculations the next day.
(G) Plasma viremia. Dotted line and grey-shaded area indicate mean and range of background signals.
(H, I) Ratio of NGS reads (~2 × 10⁴ total reads/sample) for nefWT (red) or Δnef (green) from plasma vRNA obtained at the time of initial viremia (H) or at the time of sacrifice (I). Numbers indicate individual animals. Either nefWT or Δnef vRNA were undetectable in any samples in the animals grouped on the left (n=1) or on the right (n=2), respectively.

