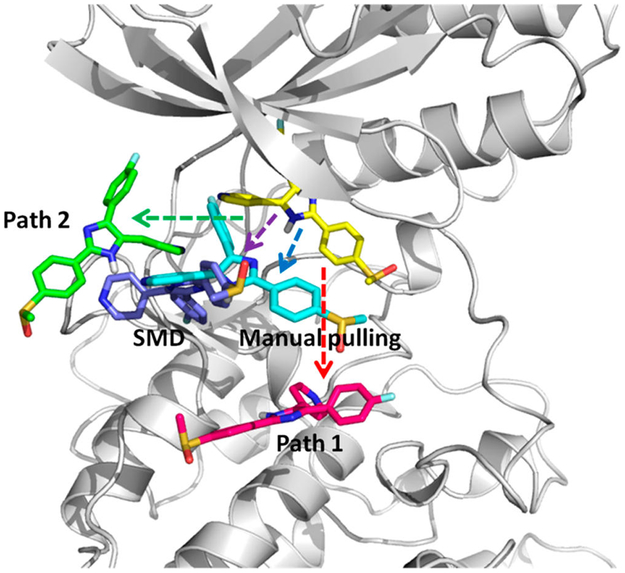
Figure 11.
Four dissociation paths for the SB2–p38α complex with the DFG-in conformation. (yellow) Crystal bound conformation of SB2. (red) Path1, where SB2 direct moves toward the outside. (green) Path2, where SB2 diffuses on the surface of the hinge region until moving out. (cyan) Manual pulling path. (purple) SMD path. SB2 in manual pulling and SMD paths moves out along directions between the two directions of path1 and 2.

