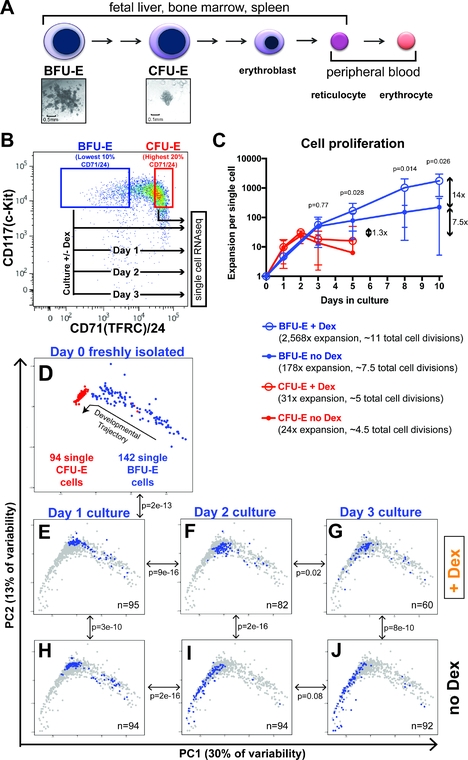
Figure 1 – Glucocorticoids slow progression of early erythroid progenitor cells through a continuum of transcriptomic states.
(A) Existing model for distinct cell stages of erythropoiesis based on colony forming assays and cellular morphology. (B) FACS-sorting strategy for isolation of BFU-E and CFU-E enriched populations from mouse fetal liver, and experimental schema for serial single cell transcriptome profiling of ex vivo cultured BFU-E cells. (C) Proliferative capacities of BFU-E and CFU-E enriched populations with and without 100nM Dex when cultured in progenitor culture media (PCM). Cultures initiated with 10,000 cells in 1mL PCM, with cells split every 2–3 days. Population expansion normalized to a single cell. Error bars indicate standard deviation. P-values comparing BFU-E + Dex and BFU-E no Dex calculated with Student’s T-Test. N = 8 biological replicates. (D-J) PCA of all single cell transcriptomes in this study, displayed as: (D) single BFU-E and CFU-E cell transcriptomes with proposed trajectory of developmental progression. (E-J) BFU-E cells cultured for 1, 2, and 3 days without Dex (H-J), or with Dex (E-G). Blue dots indicate transcriptomes for individual cells on each day with indicated Dex treatment status, background gray dots indicate transcriptomes of all single cells analyzed in this study. N denotes number of single cell transcriptomes that passed all sequence quality control filters. P-values calculated with multivariate Pillai’s statistic comparing the likelihood that the transcriptomes of the two cell populations indicated by the double arrow occupy the same distributions in two-dimensional PC1 vs PC2 space. See also Supplementary Figures S1-S3.

