
Figure 5 -.
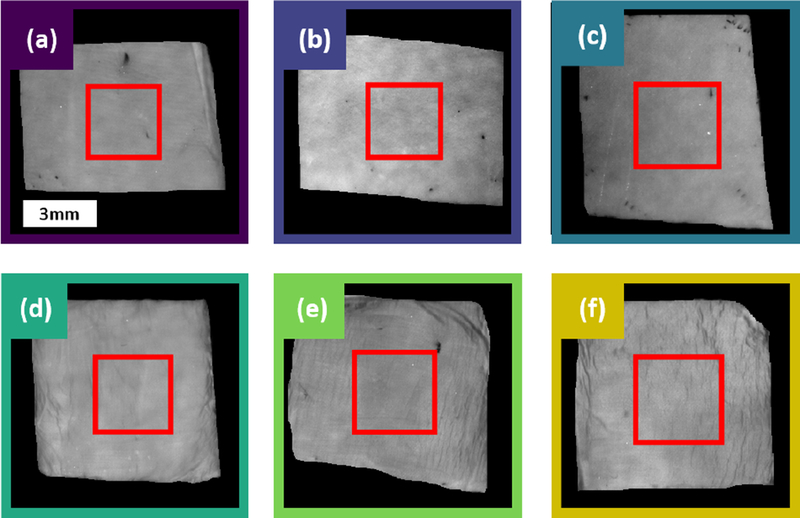
Raw images of the six fiber samples, with colors and letters corresponding to the same samples in Figure 4. The red box indicates the region of interest over which pSFDI measurements were averaged.
Official websites use .gov
A
.gov website belongs to an official
government organization in the United States.
Secure .gov websites use HTTPS
A lock (
) or https:// means you've safely
connected to the .gov website. Share sensitive
information only on official, secure websites.
Raw images of the six fiber samples, with colors and letters corresponding to the same samples in Figure 4. The red box indicates the region of interest over which pSFDI measurements were averaged.