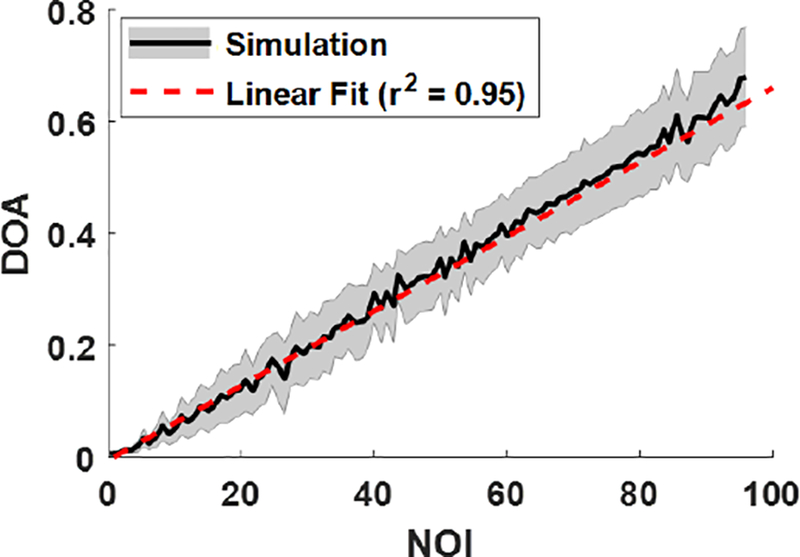
Figure 7 -.

Simulated DOA as a function of NOI, for a range of physiologically relevant fiber distributions, sizes, and relative refractive indices. The shaded region is the standard deviation of simulated DOA at each evaluated NOI value. The linear fit was inverted to estimate NOI as a function of DOA.
