
Figure 8 -.
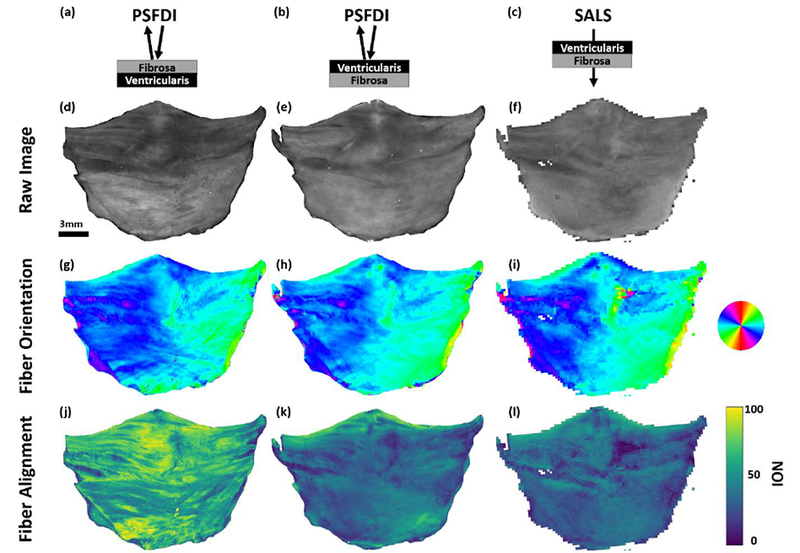
Ovine aortic valve leaflet imaging results. (a–c) Imaging geometry for the results in each column. (d–f) Raw intensity images for each technique. (g–i) Extracted fiber orientation, showing good agreement between each technique. (j–l) Extracted degree of fiber alignment from each technique. The pSFDI results show the ability to limit sampling depth to specific sides of the sample, while these results are obscured in the transmissive SALS technique. The results also indicate that the majority of the fiber alignment was present on the fibrosa side of the sample, which was expected.