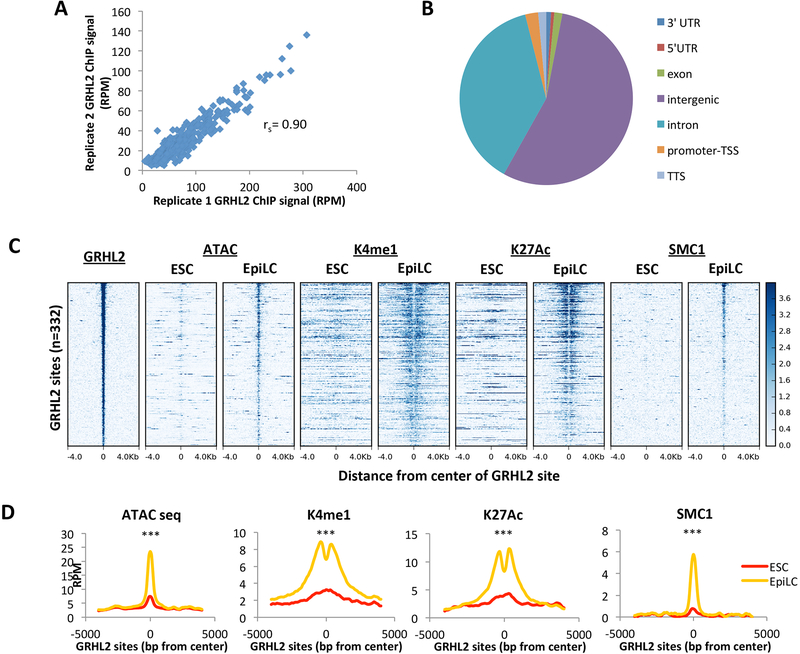
Figure 2. GRHL2 binding correlates with nucleosome removal and full enhancer activation.
A) Average GRHL2 ChIP-seq signal for a 200bp window surrounding GRHL2 sites in replicate 1 vs replicate 2, plotted as reads per million. Spearman’s correlation = 0.90 B) Genome annotation of GRHL2 binding sites defined by UCSC mouse genome annotation v5.4. C) Heatmaps at EpiLC GRHL2 sites for enhancer marks in ESCs and EpiLCs. All plots are shown for an 8kb window centered at GRHL2 binding sites. Sites are shown in descending order based on mean GRHL2 ChIP signal intensity. D) Metagene analysis of average signal across GRHL2 sites for heatmaps shown in (C). All plots are shown for an 8000bp window centered at GRHL2 binding sites. RPM = reads per million. K4me1 p = 1.36E-41; K27ac p = 6.80E-15; SMC1 p = 3.73E-34; ATAC-seq p = 2.78E-65 (paired t-test).

