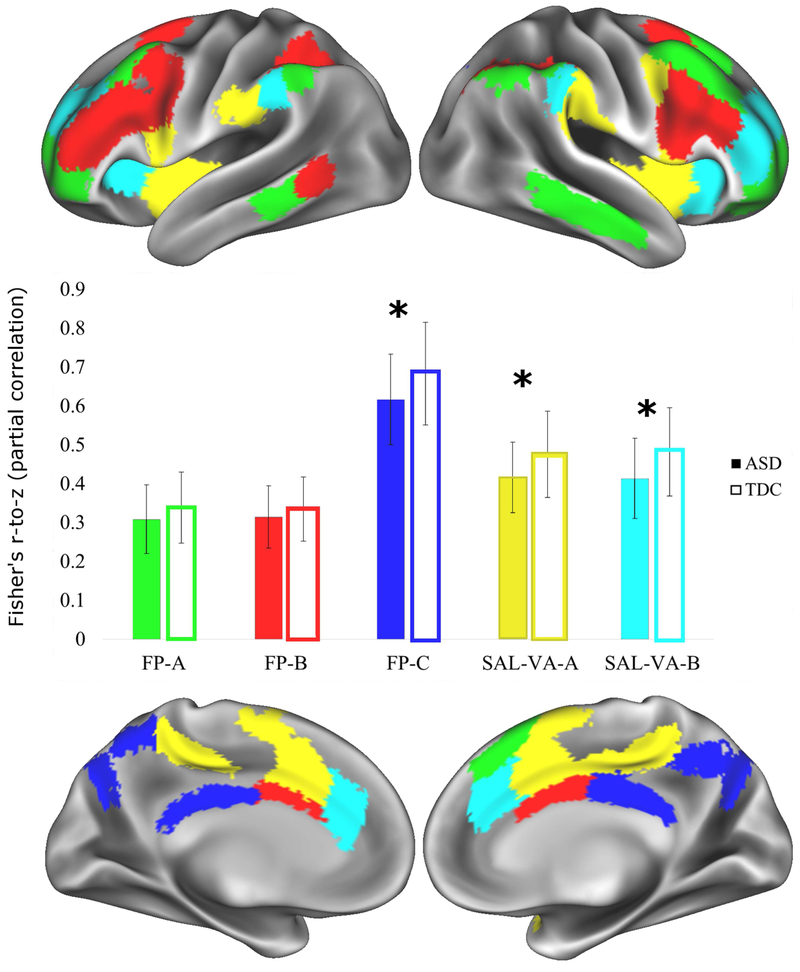
Figure 1.

The three fronto-parietal and two salience/ventral attention sub-networks are shown here on an inflated brain on the 32,000 vertex Conte atlas available with Workbench. Green=fronto-parietal-A (FP-A); Red=fronto-parietal-B (FP-B); Dark Blue=fronto-parietal-C (FP-C); Yellow=salience/ventral attention-A (SAL-VA-A); Light Blue=salience/ventral attention-B (SAL-VA-B). The bar graph in the middle shows the means of group differences for within-sub-network functional connectivity, and the error bars represent the standard deviations. Significant group differences with Welch’s two group t-test, Bayesian analysis, and analysis of covariance surviving FDR-correction are denoted with an asterisk (*). The ASD group had significantly weaker functional connectivity within three subnetworks: fronto-parietal-C, t(156.35)=3.39, FDR-corrected p-value=0.004, Hedges g=0.53, [0.028, 0.106]; fronto-parietal-C, t(154.24)=3.65, FDR-corrected p-value=0.003, Hedges g=0.573, [0.027, 0.091]; salience/ventral attention-B, t(156.9)=3.98, FDR-corrected p-value=0.002, Hedges g=0.627, [0.034, 0.102].
