
Figure 4.
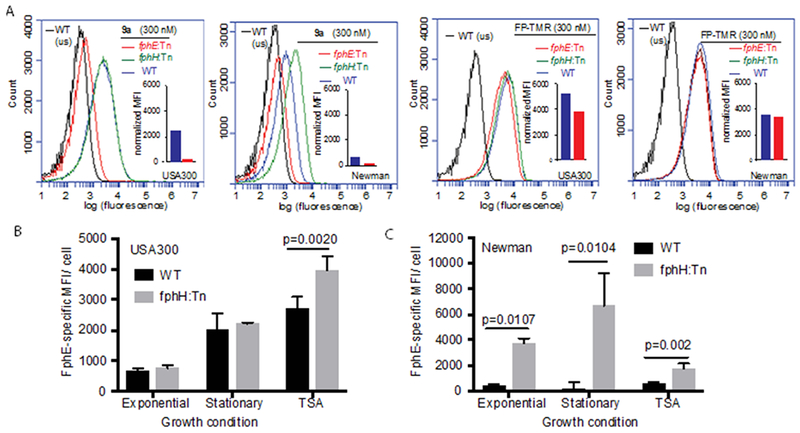
Single-cell analysis of S. aureus cells labeled with probe 9a by flow cytometry. A) Representative plot of cellular fluorescence levels for indicated S. aureus strains harvested from TSAMg and labelled with 9a or FP-TMR. Cells were analyzed by flow cytometry (552 nm laser excitation, 586 nm emission filter) after fixation. Insets show corresponding normalized mean fluorescence intensity (MFI) values for wt and transposon mutant strain fphE:Tn after subtracting MFI from unstained control samples. B, C) Plots of FphE-specific MFI values of PFA-fixed USA300 (B) or Newman (C) wt or fphH:Tn cells labeled with 300 nM of 9a at indicated growth conditions and analyzed by flow cytometry. Primary MFI values were normalized by subtracting the average MFI value of fphE:Tn control samples. Graphs shows means ± S.D. of three independent culture replicates per condition. Statistical significance was tested by unpaired two-tailed Student’s t-test.