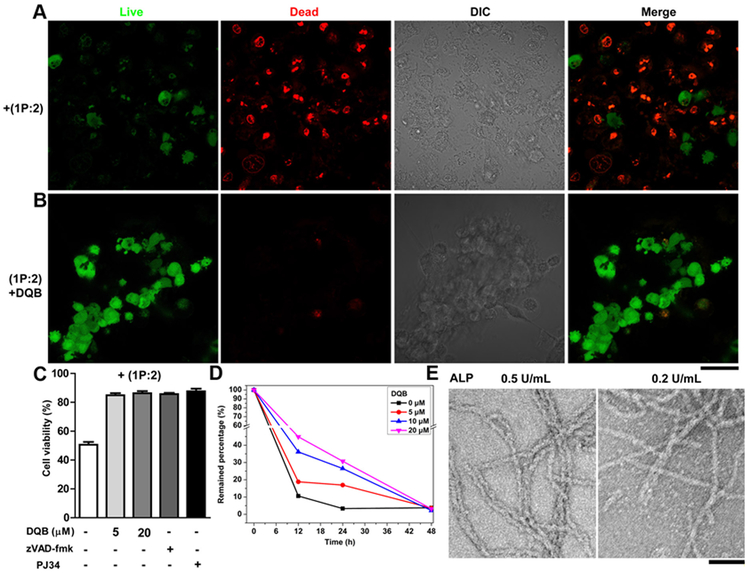
Figure 2. iA of sPGP controls cell fate depending on the activity of enzyme.
Fluorescent images of live-dead assay of Saos-2 cell lines treated with (A) 1P (500 μM) plus vancomycin (2, 500 μM) and (B) 1P, 2, and DQB (5 μM) for 48 h. Green indicates the live cells and red the dead cells. (C) Viability of Saos-2 cells cultured with (1P:2) plus different concentration of DQB, zVAD-fmk (50 μM), or PJ34 (1 μM). (D) Saos-2 cells catalyzed conversion of 1P:2 within 48 h. (E) TEM images of 1P:2 (300 μM) after treated by a phosphatase (ALP, 24 h) at 0.5 U/mL or 0.2 U/mL. Scale bar is 50 nm (in B and E).

