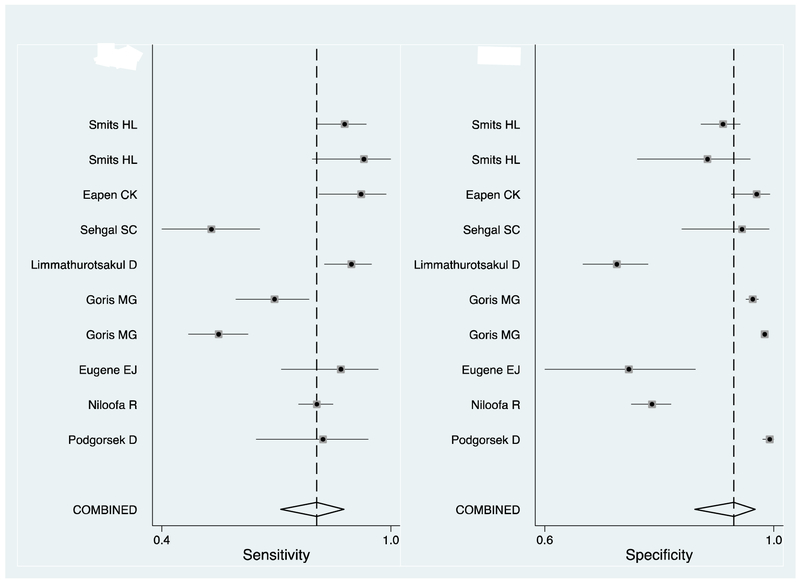
Figure 2. Forest plot of sensitivity and specificity of Patoc antigen lateral flow assays for the diagnosis of leptospirosis, published prior to 4 July 2017.
Key: The squares indicate the point estimate of sensitivity or specificity from each study, and the line indicates the 95% confidence intervals. The vertical dotted line indicates the point meta-estimate of sensitivity or specificity, and the diamond indicates the 95% confidence intervals

