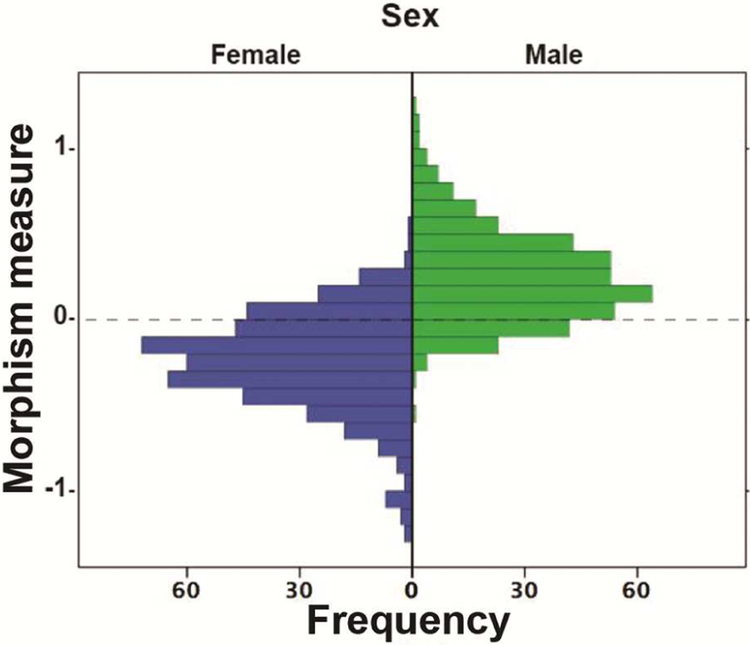
Figure 2: Histogram of Likelihood ratio “Differentiation measure”.
Note: On the left of the histogram the distribution of the differentiation measure (degree of sex differentiating features) is shown for females. Females with a very negative differentiation measure have a high level of female skewed brain features; females with scores closer to zero have a greater mix of male and female-biased features and females with very positive scores have a high level of male-biased features. On the right is the distribution of the differentiation measure for males. Males with a very positive differentiation measure have a high level of male skewed brain features; males with scores closer to zero have a greater mix of male and female-biased features and males with very positive scores have a high level of male-biased features.

