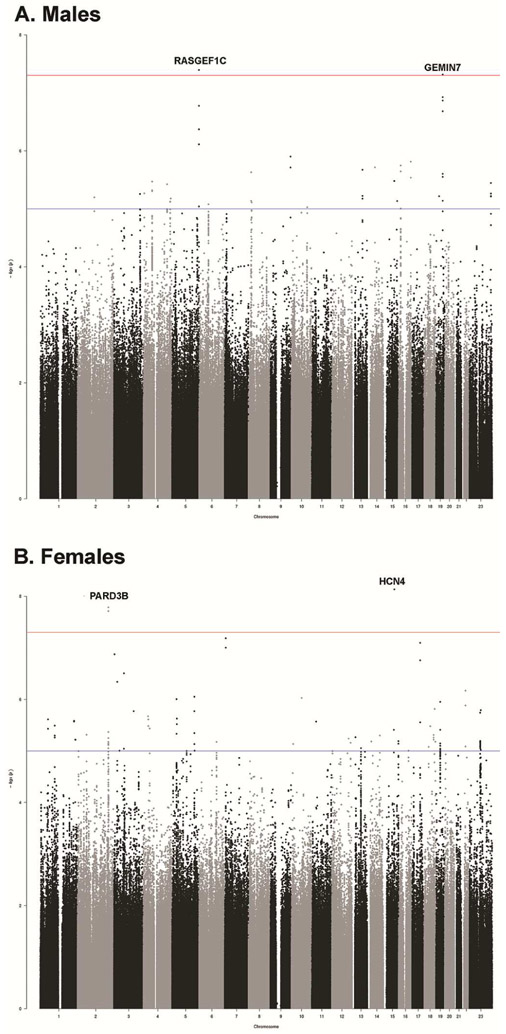
Figure 3: Genome Wide Association for the Differentiation Measure.
Note: A) Manhattan plot of the meta-analyses for males and the differentiation measure. B) Manhattan plot of the meta-analyses for females and the differentiation measure.
Horizontal line indicates threshold for genome-wide significance (P<5 × 10⁻⁸).

