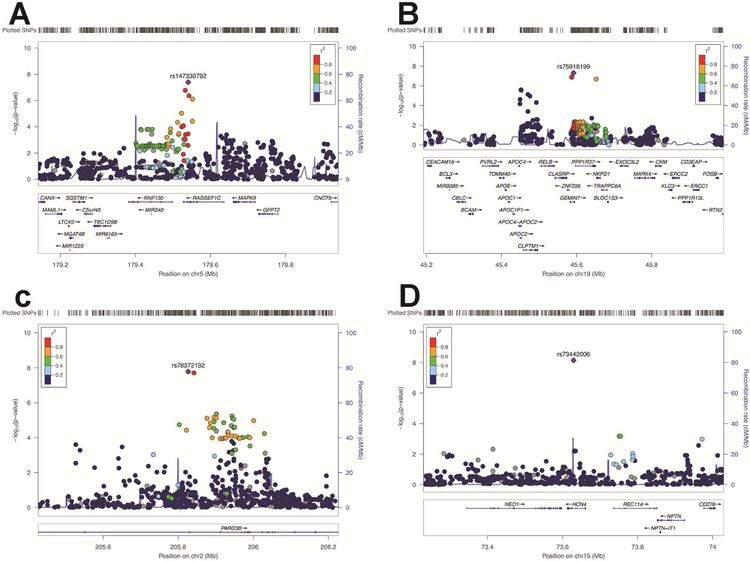
Figure 4: LocusZoom of Regional Hits for the Differentiation Measure.
Note: Regional plots of the top hit in the association results based on the meta-analysis. Blue lines indicate the recombination rate for the ASN population in the 1000 Genome Project. The Y axis is −log10(P-values) of the single nucleotide polymorphisms (SNPs) and the X axis is chromosomal position (hg19). The linkage disequilibrium (r2) between the top and the remaining SNPs is indicated by color. (a) RASGEF1C gene cluster, (b) GEMIN7, (c) PARD3B, (d) HCN4; SNPs, single nucleotide polymorphism.

