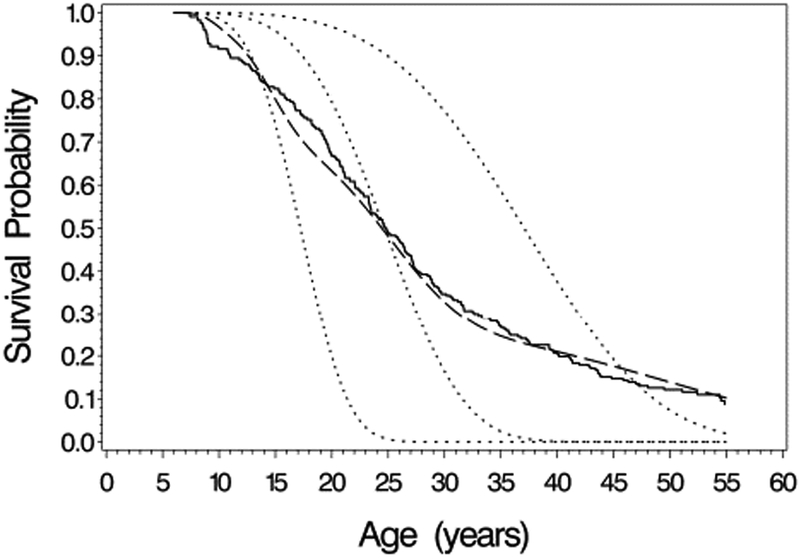
Figure 3.

Comparison of survival curve estimates for the 1950-59 birth cohort. Solid line: non-parametric estimate of marginal survival curve; Long dashed line: Weibull model estimate of marginal survival curve; short dashed lines are subject-specific survival curves from the Weibull model for subjects with random (intercept, slope) equal to (−10%, −0.5%/year), (0%, 0%/year), and (10%, 0.5%/year).
