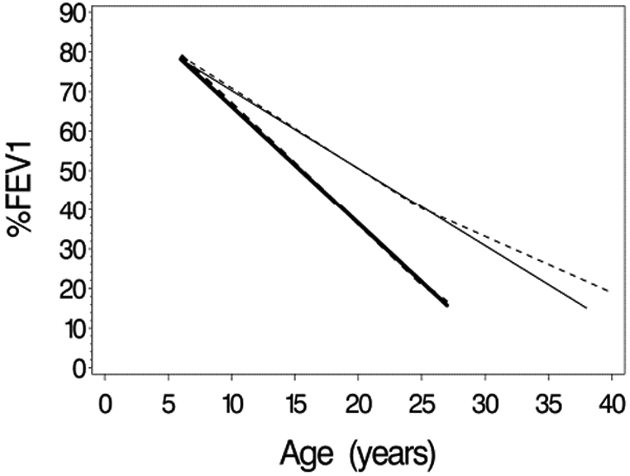
Figure 6.

Estimated mean trajectories for 1- and 2-slope Weibull models for the 1950-59 birth cohort… Solid lines are for the 1-slope model, and dashed lines are for 2-slope model. Bolded lines are for a subject with random (intercept, slope) equal to (0,0), and unbolded lines are for a subject with random (intercept, slope) equal to (0,1).
