Fig. 2.
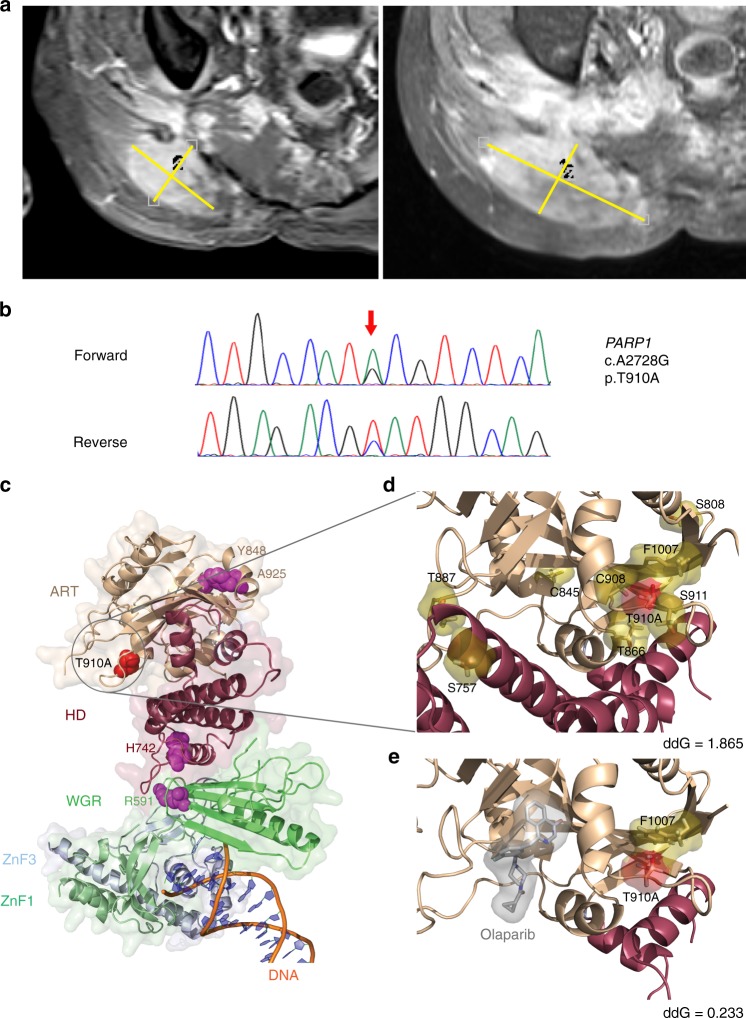
Acquired resistance to olaparib treatment in chordoma. a T1-weighted, fat-saturated, post-contrast MRI after 7 months (stable disease; left panel) and 10 months (progressive disease; right panel) of olaparib therapy. A biopsy for WGS was taken at progression (right panel). b Missense mutation in PARP1 exon 20 detected by Sanger sequencing. Nucleotide (arrow) and amino acid substitutions are given next to the chromatograms. Sequence numbering is according to NCBI Reference Sequences NM_001618 and NP_001609. c Structure of p.T910A-mutant PARP1 bound to DNA (PDB ID: 4DQY). Side chains of amino acids whose mutation has been linked to PARP1 inhibitor resistance (T910, this study; R591, H742, Y848, and A925, ref. 19) are represented as spheres. WGR tryptophan-glycine-arginine-rich domain; ZnF1 zinc-finger domain 1; ZnF3 zinc-finger domain 3. d Detail view of the p.T910A mutation site in the PARP1-DNA complex structure (PDB ID: 4DQY). Threonine 910 and amino acids whose side chains are displaced according to energy calculations (cut-off, 0.05 Ǻ) are represented as red and olive sticks and surfaces, respectively. e Detail view of the p.T910A mutation site in the structure of constitutively active PARP1 (PDB ID: 5DS3) in complex with olaparib (represented as gray sticks and surface)

