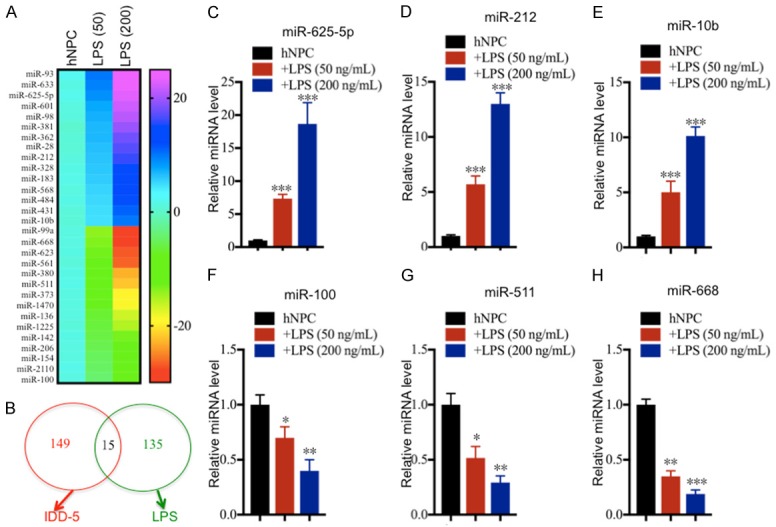
Figure 4.

miR-625-5p is induced by LPS treatment. (A) The heat maps of differentially expressed miRNAs by LPS treatment. hNPC cells were treated with different concentrations of LPS (0, 50 or 200 ng/mL), followed by RNA isolation and microarray analysis. The 15 up-regulated and 15 down-regulated miRNAs with the most obvious changes are shown. (B) Comparing the two microarray analysis results. The two independent microarray results (IDD tissues and hNPC cells treated with LPS) were subjected to similarity comparison. (C-H) Verification of miRNA levels in samples from LPS-treated hNPC cells. qRT-PCR was performed to verify the expression of three up-regulated miRNAs, (C) miR-625-5p, (D) miR-212 and (E) miR-10b; and three down-regulated miRNAs, (F) miR-100, (G) miR-511, and (H) miR-107. *P < 0.05, **P < 0.01, and ***P < 0.001.
