
Figure 1.
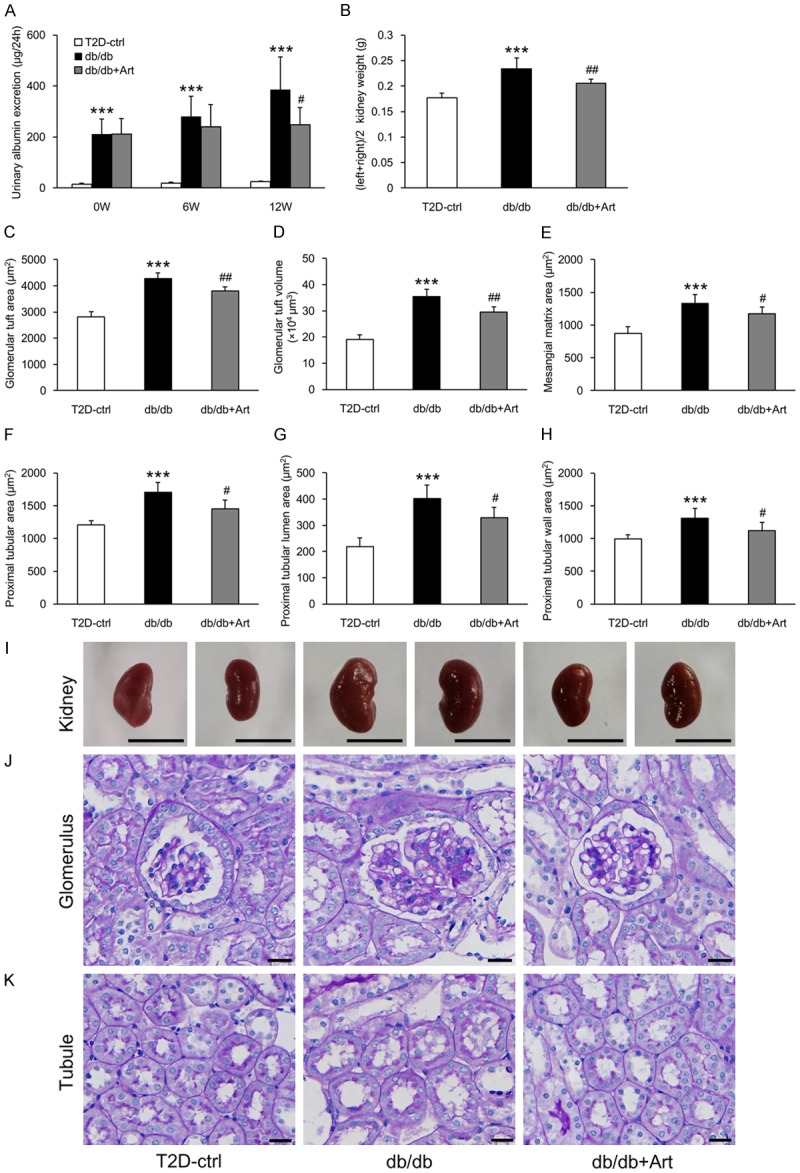
Artemether reduces urinary albumin excretion and prevents diabetic kidney hypertrophy. A. Urinary albumin excretion at 0, 6, and 12 weeks in the indicated groups. B. Kidney weight in each group at the end of the study. C-E. Bar graphs indicating the GTA, GTV, and mesangial matrix area of each group. F-H. Bar graphs indicating the proximal tubular area, tubular lumen, and wall area in various groups. I. Representative kidney images. Scale bars, 1 cm. J. PAS staining for the glomerulus. Scale bars, 20 μm. K. PAS staining for the renal tubule. Scale bars, 20 μm. n=6 per group. ***P<0.001 vs. the T2D-ctrl group. #P<0.05 and ##P<0.01 vs. the db/db group.