
Figure 3.
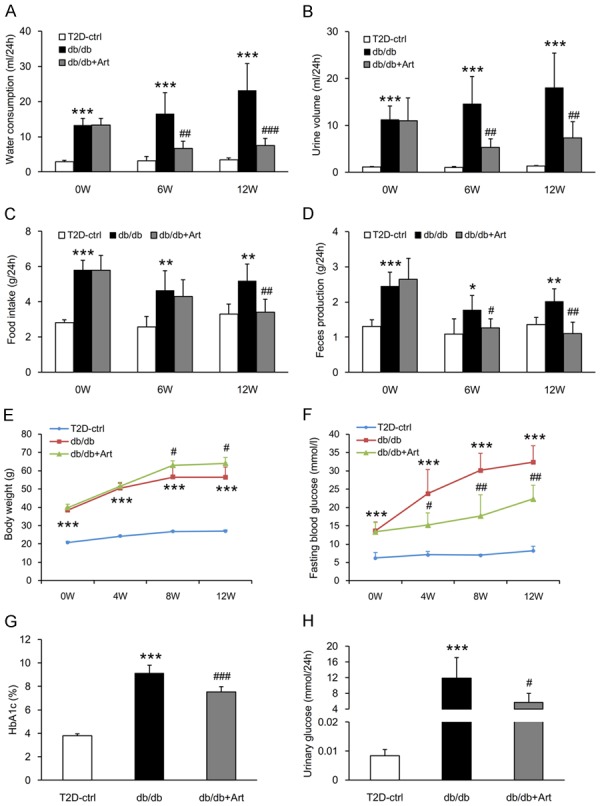
Artemether improves diabetic symptoms and protects against hyperglycemia. (A) Water consumption, (B) Urine volume, (C) Food intake, and (D) Feces production at 0, 6, and 12 weeks in various groups. (E, F) Line charts indicating the changes of body weight and fasting blood glucose during the course of the experiment. (G, H) Bar graphs representing the quantification of HbA1c and urinary glucose at the end of the study. n=6 per group. *P<0.05, **P<0.01 and ***P<0.001 vs. the T2D-ctrl group. #P<0.05, ##P<0.01 and ###P<0.001 vs. the db/db group.