
Figure 7.
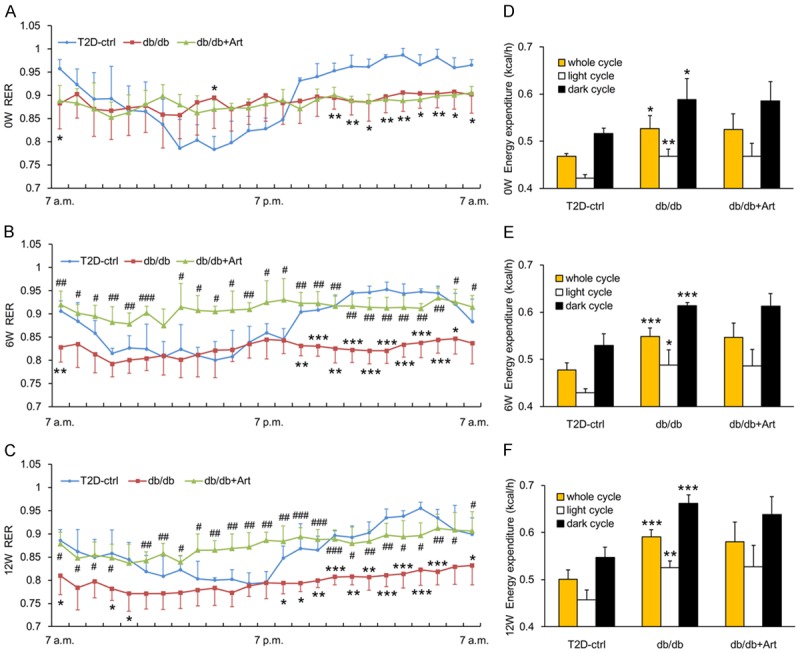
Effects of artemether on RER and energy expenditure. A-C. Line charts indicating changes of RER throughout the entire day at 0, 6, and 12 weeks in various groups. D-F. Bar graphs representing the quantification of energy expenditure at 0, 6, and 12 weeks in different groups. n=4 per group. *P<0.05, **P<0.01 and ***P<0.001 vs. the T2D-ctrl group. #P<0.05, ##P<0.01 and ###P<0.001 vs. the db/db group.