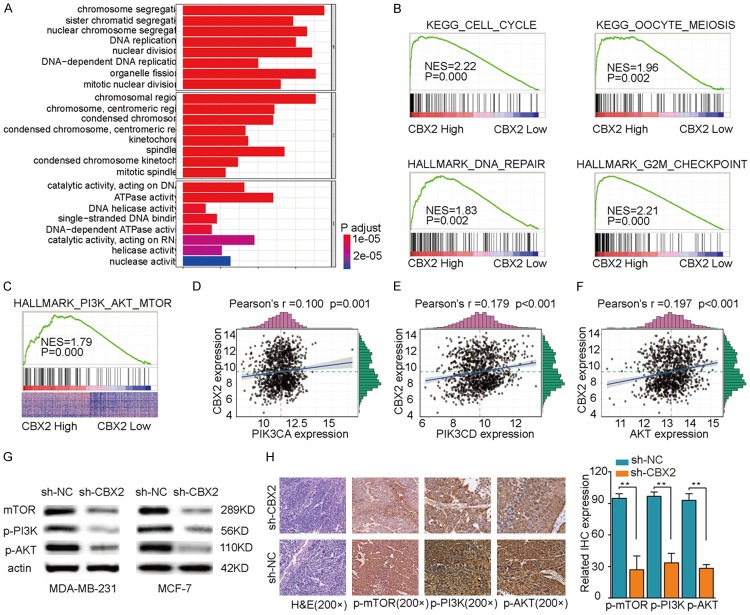
Figure 5.
Functional and pathway enrichment analysis. A. Analysis of correlation between expressions of CBX2 and cell cycle-related genes. B. KEGG and GO enrichment analysis of correlation between differentially expressed CBX2 genes and cell cycle, as well as DNA replication pathway-related genes. C. GO enrichment analysis of correlation between differentially expressed CBX2 genes and PI3K/AKT pathway related genes. D-F. Analyses of correlations between expression of CBX2 and expressions of PIK3CA, PIK3CD, and AKT. G. Western blot analysis showing that the expressions of p-mTOR, p-PI3K, and p-AKT were significantly decreased in the sh-CBX2 group compared to the sh-NC group. H. Representative images of immunohistochemically stained mouse tumor sections (left) and bar graphical quantitation of IHC expression scores (right) showing that the expressions of p-mTOR, p-PI3K, and p-AKT were significantly decreased in the sh-CBX2 group compared to the sh-NC group. **P<0.01.

