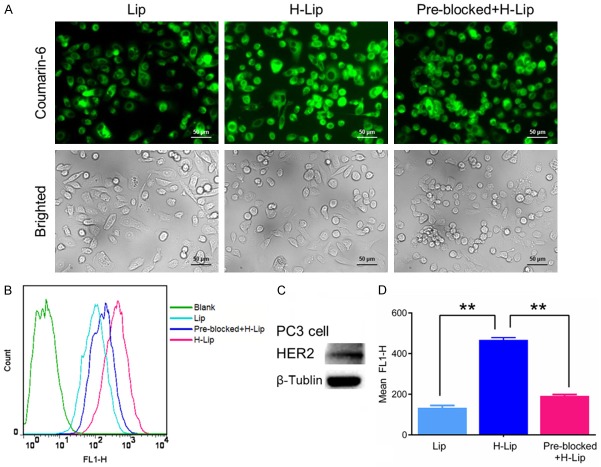
Figure 2.
Cellular uptake of the liposomes. A. Fluorescence images of the cells treated with liposomes. Scale bar: 50 μm. B. Flow cytometry analysis of the uptake efficiency of the liposomes. C. HER-2 expression in the tumor cells. D. Quantitative analysis of fluorescence intensity. The statistically significant difference was defined as *P < 0.05, **P < 0.01, and ***P < 0.001.

