
Figure 5.
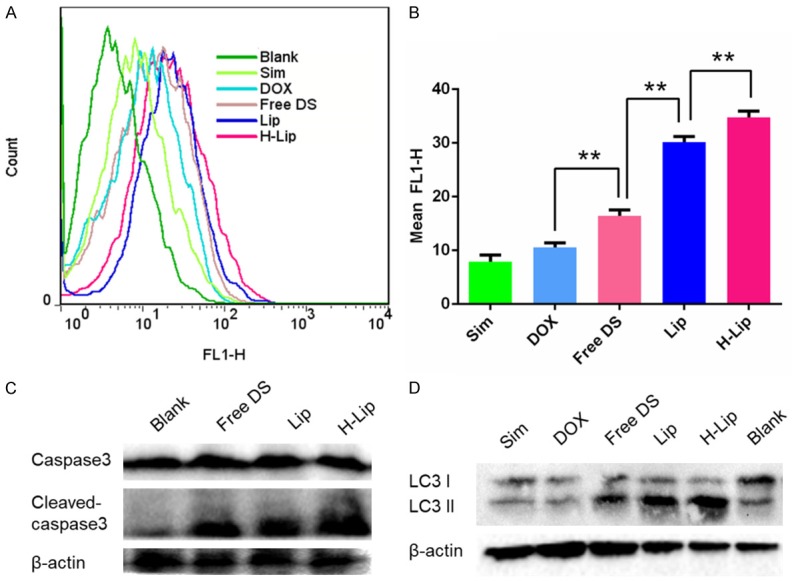
Study on the mechanisms of the liposomes. A. Flow cytometry analysis of intracellular levels of ROS. B. Quantitative analysis of fluorescence intensity. C. Western blotting of caspase-3 expression. D. Western blotting analysis of autophagy expression in PC3 cells. The statistically signifigcant difference was analysised by student t-test and defined as *P < 0.05, **P < 0.01, and ***P < 0.001.