Figure 1.
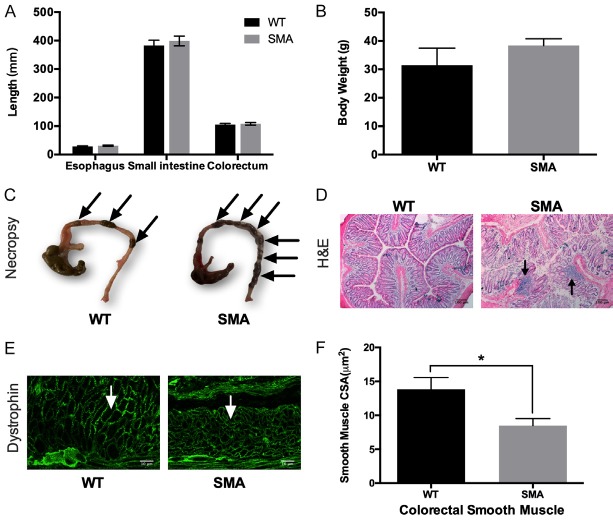
Anatomical features of the SMN2; Smn; PrP92-SMN mouse (SMA mouse) strain. (A) No difference was observed in Esophagus, Small Intestine and Colorectum lengths or (B) Body weight between SMA and WT mice. (C) The colon was dissected from SMA and WT mice. The arrows points to well-pelleted feces. SMA mice displayed increased numbers of pelleted-feces, indicating constipation. (D) H&E staining of SMA and WT colon. Secondary lesions (arrow) were present in SMA mice. (E) Representative images of colon smooth muscles stained for dystrophin. (F) Quantification of colon smooth muscle CSA. SMA mice have approximately 35% smaller smooth muscle CSA, compared to WT (8.476 ± 1.052 µm2 N=7 vs 13.82 ± 1.735 µm2 N=7, P=0.0218), exhibiting a significant shift in distribution towards smaller CSA fibers (Kolmogorov-Smirnov D=0.2584, P < 0.0001).

