
Figure 3.
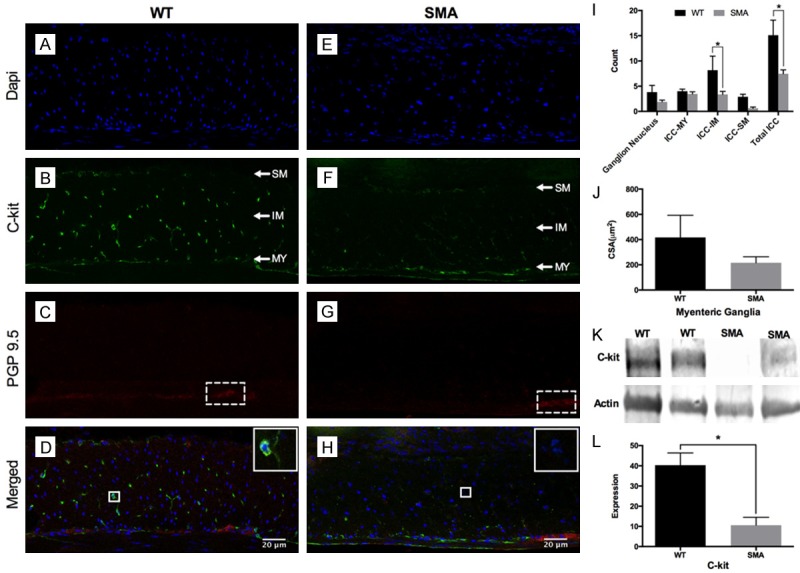
Histological investigation on distribution and abundance of ENS and ICC. (A-H) are representative images of enteric neurons/ganglions and ICC in colons from WT and SMA mice. Enteric neurons were stained with the neuronal marker PGP9.5 (Red), ICC with c-Kit (Green) and cell nuclei were stained with DAPI (Blue). (J) The WT mice have a non-significantly larger ganglionic CSA (417.2 ± 175.3 µm2, N=6 vs 216.2 ± 47.72 µm2, N=10, P=0.1916) and ganglionic nuclei number (3.82 ± 1.335, N=6 vs 1.89 ± 0.372, N=10, P=0.7390) than SMA mice; (I) The SMA mice had a decreased trend for c-kit positive ICC compared to WT mice in the MY and SM layers, and presented significantly decreased numbers in the IM layer (3.38 ± 0.593, N=10 vs 8.18 ± 2.779, N=6, P=0.0206) and a striking 50% reduction in total ICC numbers (7.47 ± 0.779, N=10 vs 15.10 ± 2.997, N=6, P < 0.0001). (K) The immunoblots of c-Kit protein and actin. (L) Semi-quantification of c-Kit protein relative to an actin loading control. The c-kit protein level is four-fold higher in WT colon tissues compared to the SMA mice (40.31 ± 6.025 N=5 vs 10.61 ± 3.892 N=5, P=0.0032), consistent with the immunofluorescence imaging results.