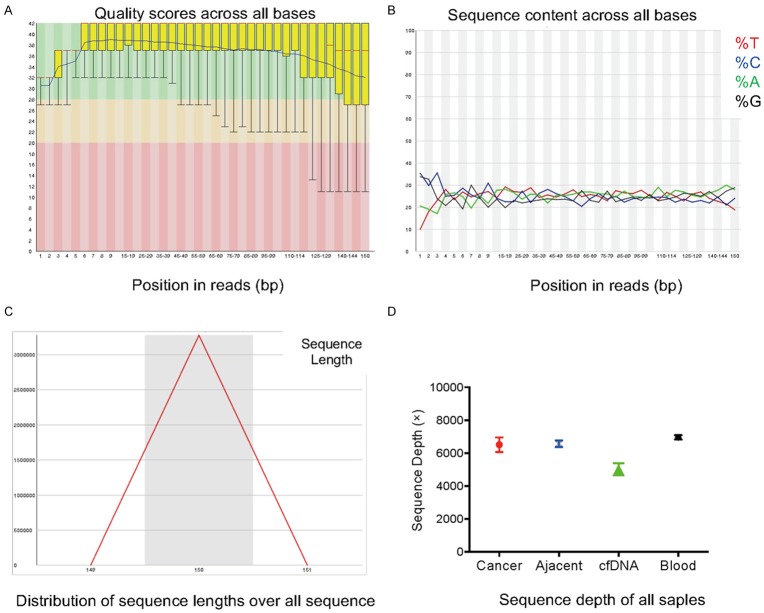
Figure 1.
Representative results for quality control analysis of the data from amplicon sequencing. A. Sequencing quality control score of each base position in the sequencing fragment (yellow represents the quartile spacing, the red line represents the median, and the blue line represents the average); B. A/C/T/G four-base distributions in each base position of the sequencing fragments; C. Size distribution of the sequencing fragments; D. The average sequencing depth analysis of all the samples.

