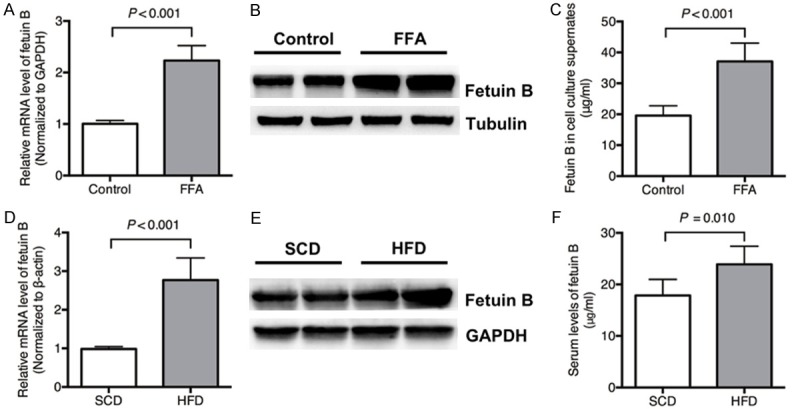
Figure 1.

Expression of fetuin B in HepG2 cells and mice. The levels of fetuin B mRNA and protein in HepG2 cells and cell culture supernatants increased with FFAs compared with controls. The levels of fetuin B mRNA and protein in mice increased in the HFD group compared with the SCD group. A: The mRNA levels: Control vs. FFAs (P < 0.001); B: The protein expression of fetuin B in HepG2 cells; C: The protein levels in the culture supernatants of HepG2 cells (P < 0.001); (HepG2 experiment) Results are the mean ± SD of three independent experiments, each repeated in triplicate. D: The hepatic mRNA level: SCD vs. HFD (P < 0.001); E: The hepatic protein expression; F: The serum levels (SCD vs. HFD, P = 0.010); (Mouse experiment) Results are the mean ± SD of three independent experiments (n = 6, each group).
